Laotian vs Filipino Householder Income Ages 45 - 64 years
COMPARE
Laotian
Filipino
Householder Income Ages 45 - 64 years
Householder Income Ages 45 - 64 years Comparison
Laotians
Filipinos
$111,051
HOUSEHOLDER INCOME AGES 45 - 64 YEARS
99.5/ 100
METRIC RATING
67th/ 347
METRIC RANK
$134,910
HOUSEHOLDER INCOME AGES 45 - 64 YEARS
100.0/ 100
METRIC RATING
2nd/ 347
METRIC RANK
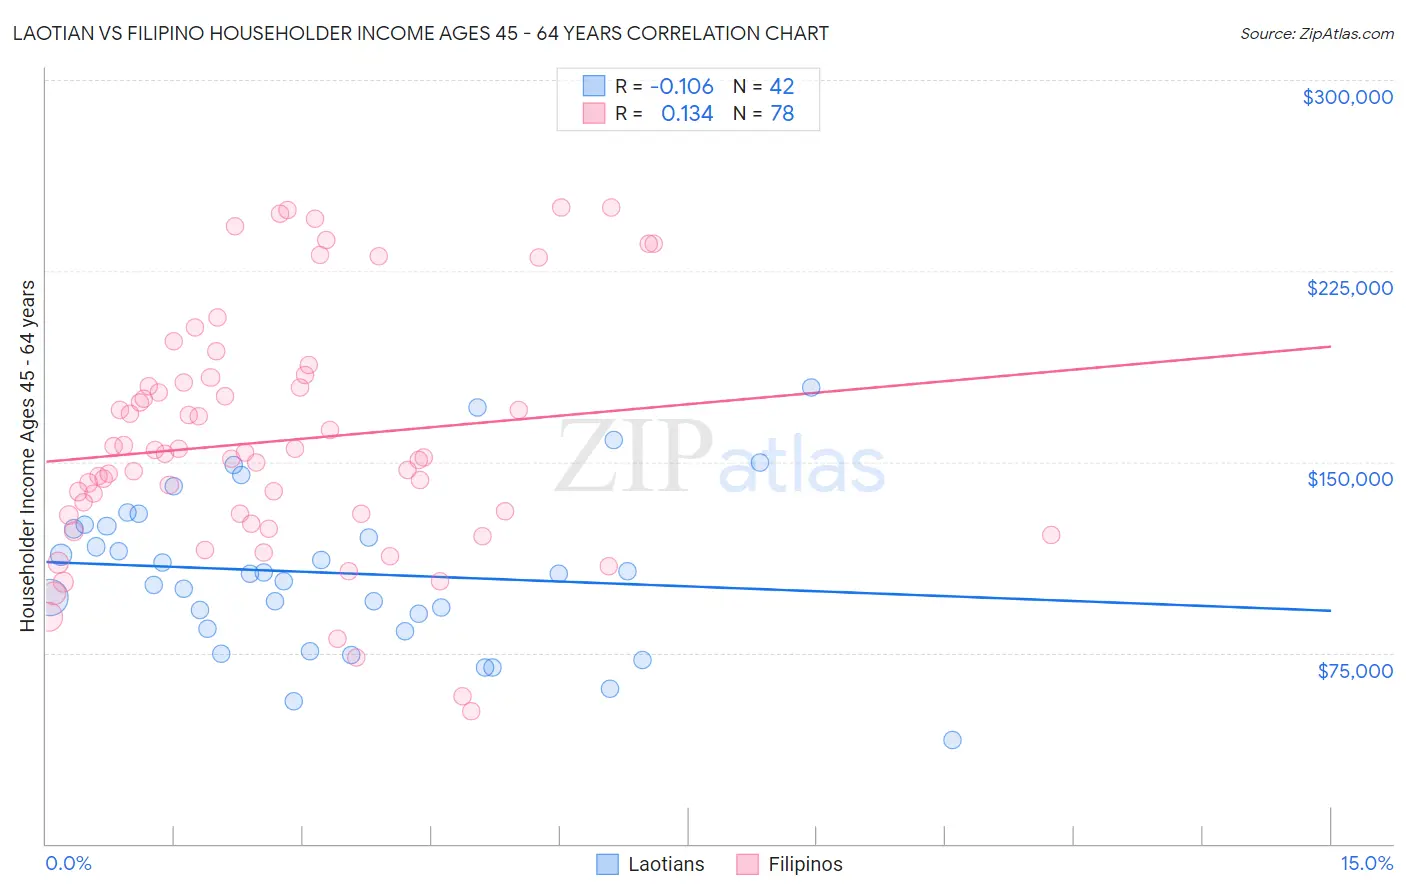
Laotian vs Filipino Householder Income Ages 45 - 64 years Correlation Chart
The statistical analysis conducted on geographies consisting of 224,613,434 people shows a poor negative correlation between the proportion of Laotians and household income with householder between the ages 45 and 64 in the United States with a correlation coefficient (R) of -0.106 and weighted average of $111,051. Similarly, the statistical analysis conducted on geographies consisting of 254,006,751 people shows a poor positive correlation between the proportion of Filipinos and household income with householder between the ages 45 and 64 in the United States with a correlation coefficient (R) of 0.134 and weighted average of $134,910, a difference of 21.5%.
Householder Income Ages 45 - 64 years Correlation Summary
| Measurement | Laotian | Filipino |
| Minimum | $40,547 | $51,856 |
| Maximum | $179,286 | $250,001 |
| Range | $138,739 | $198,145 |
| Mean | $106,378 | $158,185 |
| Median | $106,231 | $152,545 |
| Interquartile 25% (IQ1) | $84,487 | $128,904 |
| Interquartile 75% (IQ3) | $124,834 | $181,123 |
| Interquartile Range (IQR) | $40,347 | $52,219 |
| Standard Deviation (Sample) | $30,879 | $46,977 |
| Standard Deviation (Population) | $30,509 | $46,675 |
Similar Demographics by Householder Income Ages 45 - 64 years
Demographics Similar to Laotians by Householder Income Ages 45 - 64 years
In terms of householder income ages 45 - 64 years, the demographic groups most similar to Laotians are New Zealander ($111,286, a difference of 0.21%), Immigrants from Belarus ($111,430, a difference of 0.34%), Immigrants from Latvia ($111,454, a difference of 0.36%), Immigrants from Romania ($110,633, a difference of 0.38%), and Mongolian ($111,602, a difference of 0.50%).
| Demographics | Rating | Rank | Householder Income Ages 45 - 64 years |
| Immigrants | Netherlands | 99.7 /100 | #60 | Exceptional $111,982 |
| Immigrants | Czechoslovakia | 99.7 /100 | #61 | Exceptional $111,914 |
| Immigrants | Norway | 99.7 /100 | #62 | Exceptional $111,669 |
| Mongolians | 99.6 /100 | #63 | Exceptional $111,602 |
| Immigrants | Latvia | 99.6 /100 | #64 | Exceptional $111,454 |
| Immigrants | Belarus | 99.6 /100 | #65 | Exceptional $111,430 |
| New Zealanders | 99.6 /100 | #66 | Exceptional $111,286 |
| Laotians | 99.5 /100 | #67 | Exceptional $111,051 |
| Immigrants | Romania | 99.4 /100 | #68 | Exceptional $110,633 |
| Immigrants | Italy | 99.4 /100 | #69 | Exceptional $110,434 |
| Koreans | 99.3 /100 | #70 | Exceptional $110,334 |
| Italians | 99.3 /100 | #71 | Exceptional $110,224 |
| Assyrians/Chaldeans/Syriacs | 99.3 /100 | #72 | Exceptional $110,201 |
| Argentineans | 99.3 /100 | #73 | Exceptional $110,103 |
| Immigrants | Egypt | 99.2 /100 | #74 | Exceptional $109,941 |
Demographics Similar to Filipinos by Householder Income Ages 45 - 64 years
In terms of householder income ages 45 - 64 years, the demographic groups most similar to Filipinos are Immigrants from Taiwan ($135,508, a difference of 0.44%), Immigrants from India ($132,488, a difference of 1.8%), Thai ($129,560, a difference of 4.1%), Immigrants from Singapore ($129,514, a difference of 4.2%), and Iranian ($129,350, a difference of 4.3%).
| Demographics | Rating | Rank | Householder Income Ages 45 - 64 years |
| Immigrants | Taiwan | 100.0 /100 | #1 | Exceptional $135,508 |
| Filipinos | 100.0 /100 | #2 | Exceptional $134,910 |
| Immigrants | India | 100.0 /100 | #3 | Exceptional $132,488 |
| Thais | 100.0 /100 | #4 | Exceptional $129,560 |
| Immigrants | Singapore | 100.0 /100 | #5 | Exceptional $129,514 |
| Iranians | 100.0 /100 | #6 | Exceptional $129,350 |
| Immigrants | Hong Kong | 100.0 /100 | #7 | Exceptional $127,500 |
| Immigrants | Iran | 100.0 /100 | #8 | Exceptional $126,940 |
| Okinawans | 100.0 /100 | #9 | Exceptional $124,796 |
| Immigrants | South Central Asia | 100.0 /100 | #10 | Exceptional $124,188 |
| Cypriots | 100.0 /100 | #11 | Exceptional $123,396 |
| Immigrants | Israel | 100.0 /100 | #12 | Exceptional $122,893 |
| Immigrants | Ireland | 100.0 /100 | #13 | Exceptional $122,757 |
| Indians (Asian) | 100.0 /100 | #14 | Exceptional $122,343 |
| Immigrants | Eastern Asia | 100.0 /100 | #15 | Exceptional $122,222 |