Latvian vs Ugandan Median Male Earnings
COMPARE
Latvian
Ugandan
Median Male Earnings
Median Male Earnings Comparison
Latvians
Ugandans
$63,498
MEDIAN MALE EARNINGS
100.0/ 100
METRIC RATING
31st/ 347
METRIC RANK
$55,290
MEDIAN MALE EARNINGS
68.6/ 100
METRIC RATING
163rd/ 347
METRIC RANK
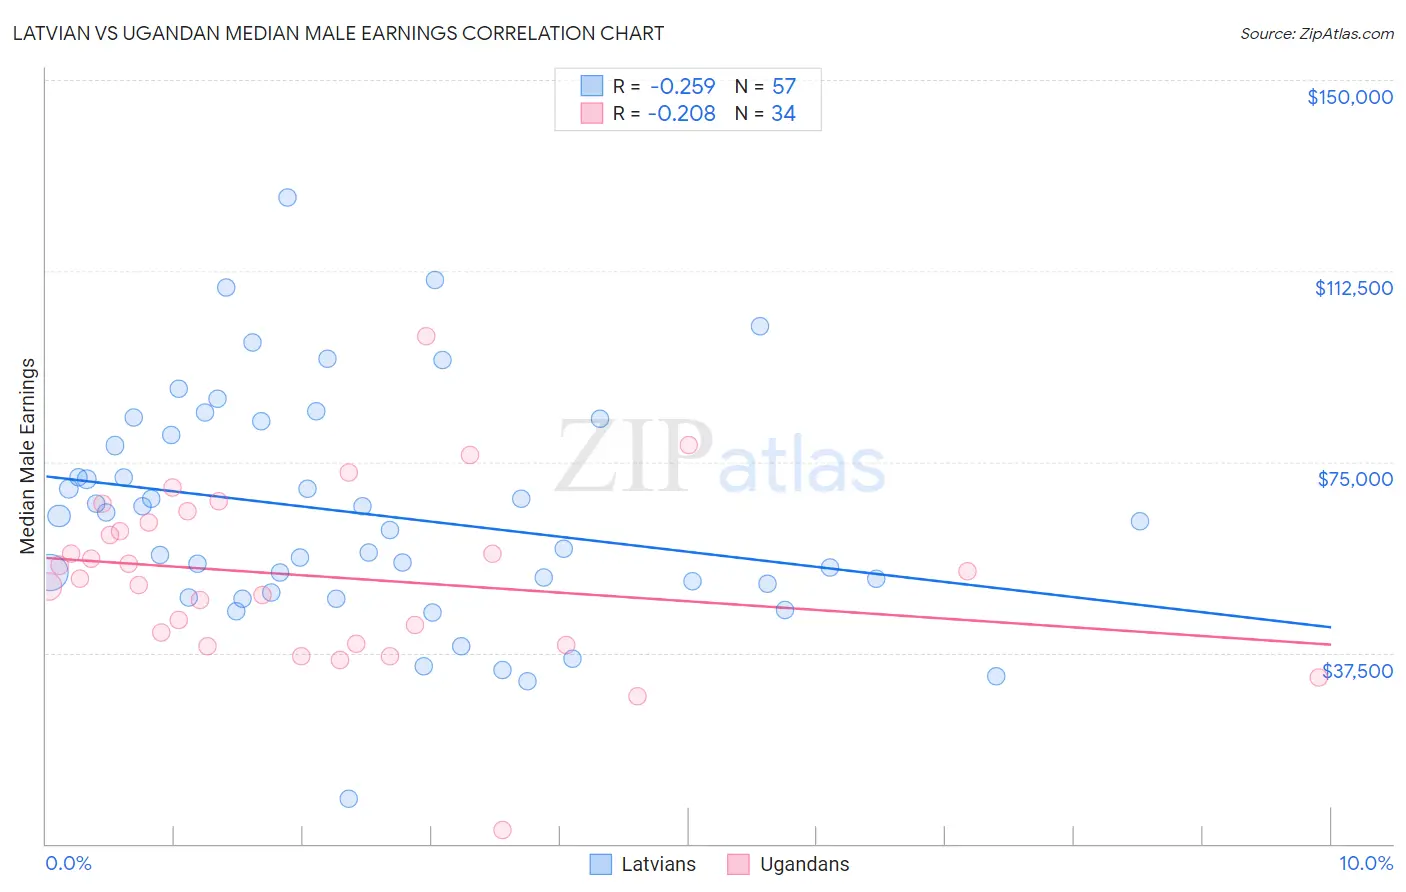
Latvian vs Ugandan Median Male Earnings Correlation Chart
The statistical analysis conducted on geographies consisting of 220,682,058 people shows a weak negative correlation between the proportion of Latvians and median male earnings in the United States with a correlation coefficient (R) of -0.259 and weighted average of $63,498. Similarly, the statistical analysis conducted on geographies consisting of 94,009,031 people shows a weak negative correlation between the proportion of Ugandans and median male earnings in the United States with a correlation coefficient (R) of -0.208 and weighted average of $55,290, a difference of 14.8%.
Median Male Earnings Correlation Summary
| Measurement | Latvian | Ugandan |
| Minimum | $8,856 | $2,614 |
| Maximum | $126,871 | $99,574 |
| Range | $118,015 | $96,960 |
| Mean | $64,757 | $52,480 |
| Median | $63,438 | $52,840 |
| Interquartile 25% (IQ1) | $50,186 | $39,217 |
| Interquartile 75% (IQ3) | $81,584 | $63,193 |
| Interquartile Range (IQR) | $31,398 | $23,975 |
| Standard Deviation (Sample) | $22,394 | $17,547 |
| Standard Deviation (Population) | $22,197 | $17,287 |
Similar Demographics by Median Male Earnings
Demographics Similar to Latvians by Median Male Earnings
In terms of median male earnings, the demographic groups most similar to Latvians are Soviet Union ($63,382, a difference of 0.18%), Immigrants from Lithuania ($63,346, a difference of 0.24%), Immigrants from Russia ($63,326, a difference of 0.27%), Immigrants from France ($63,715, a difference of 0.34%), and Immigrants from Asia ($63,240, a difference of 0.41%).
| Demographics | Rating | Rank | Median Male Earnings |
| Immigrants | Northern Europe | 100.0 /100 | #24 | Exceptional $64,987 |
| Immigrants | Denmark | 100.0 /100 | #25 | Exceptional $64,625 |
| Turks | 100.0 /100 | #26 | Exceptional $64,253 |
| Immigrants | Switzerland | 100.0 /100 | #27 | Exceptional $63,944 |
| Russians | 100.0 /100 | #28 | Exceptional $63,939 |
| Asians | 100.0 /100 | #29 | Exceptional $63,827 |
| Immigrants | France | 100.0 /100 | #30 | Exceptional $63,715 |
| Latvians | 100.0 /100 | #31 | Exceptional $63,498 |
| Soviet Union | 100.0 /100 | #32 | Exceptional $63,382 |
| Immigrants | Lithuania | 100.0 /100 | #33 | Exceptional $63,346 |
| Immigrants | Russia | 100.0 /100 | #34 | Exceptional $63,326 |
| Immigrants | Asia | 100.0 /100 | #35 | Exceptional $63,240 |
| Israelis | 100.0 /100 | #36 | Exceptional $63,228 |
| Immigrants | Sri Lanka | 100.0 /100 | #37 | Exceptional $63,099 |
| Maltese | 100.0 /100 | #38 | Exceptional $62,953 |
Demographics Similar to Ugandans by Median Male Earnings
In terms of median male earnings, the demographic groups most similar to Ugandans are Immigrants from South Eastern Asia ($55,241, a difference of 0.090%), French ($55,350, a difference of 0.11%), Belgian ($55,361, a difference of 0.13%), Basque ($55,370, a difference of 0.15%), and Alsatian ($55,380, a difference of 0.16%).
| Demographics | Rating | Rank | Median Male Earnings |
| Immigrants | Ethiopia | 71.6 /100 | #156 | Good $55,434 |
| Icelanders | 71.2 /100 | #157 | Good $55,415 |
| Czechoslovakians | 70.5 /100 | #158 | Good $55,382 |
| Alsatians | 70.5 /100 | #159 | Good $55,380 |
| Basques | 70.3 /100 | #160 | Good $55,370 |
| Belgians | 70.1 /100 | #161 | Good $55,361 |
| French | 69.9 /100 | #162 | Good $55,350 |
| Ugandans | 68.6 /100 | #163 | Good $55,290 |
| Immigrants | South Eastern Asia | 67.6 /100 | #164 | Good $55,241 |
| Immigrants | Portugal | 66.3 /100 | #165 | Good $55,182 |
| Germans | 61.6 /100 | #166 | Good $54,974 |
| Immigrants | Fiji | 61.2 /100 | #167 | Good $54,958 |
| Immigrants | Vietnam | 60.2 /100 | #168 | Good $54,913 |
| French Canadians | 55.6 /100 | #169 | Average $54,722 |
| Finns | 55.6 /100 | #170 | Average $54,721 |