Mexican American Indian vs Nepalese Wage/Income Gap
COMPARE
Mexican American Indian
Nepalese
Wage/Income Gap
Wage/Income Gap Comparison
Mexican American Indians
Nepalese
24.7%
WAGE/INCOME GAP
92.2/ 100
METRIC RATING
134th/ 347
METRIC RANK
22.2%
WAGE/INCOME GAP
100.0/ 100
METRIC RATING
54th/ 347
METRIC RANK
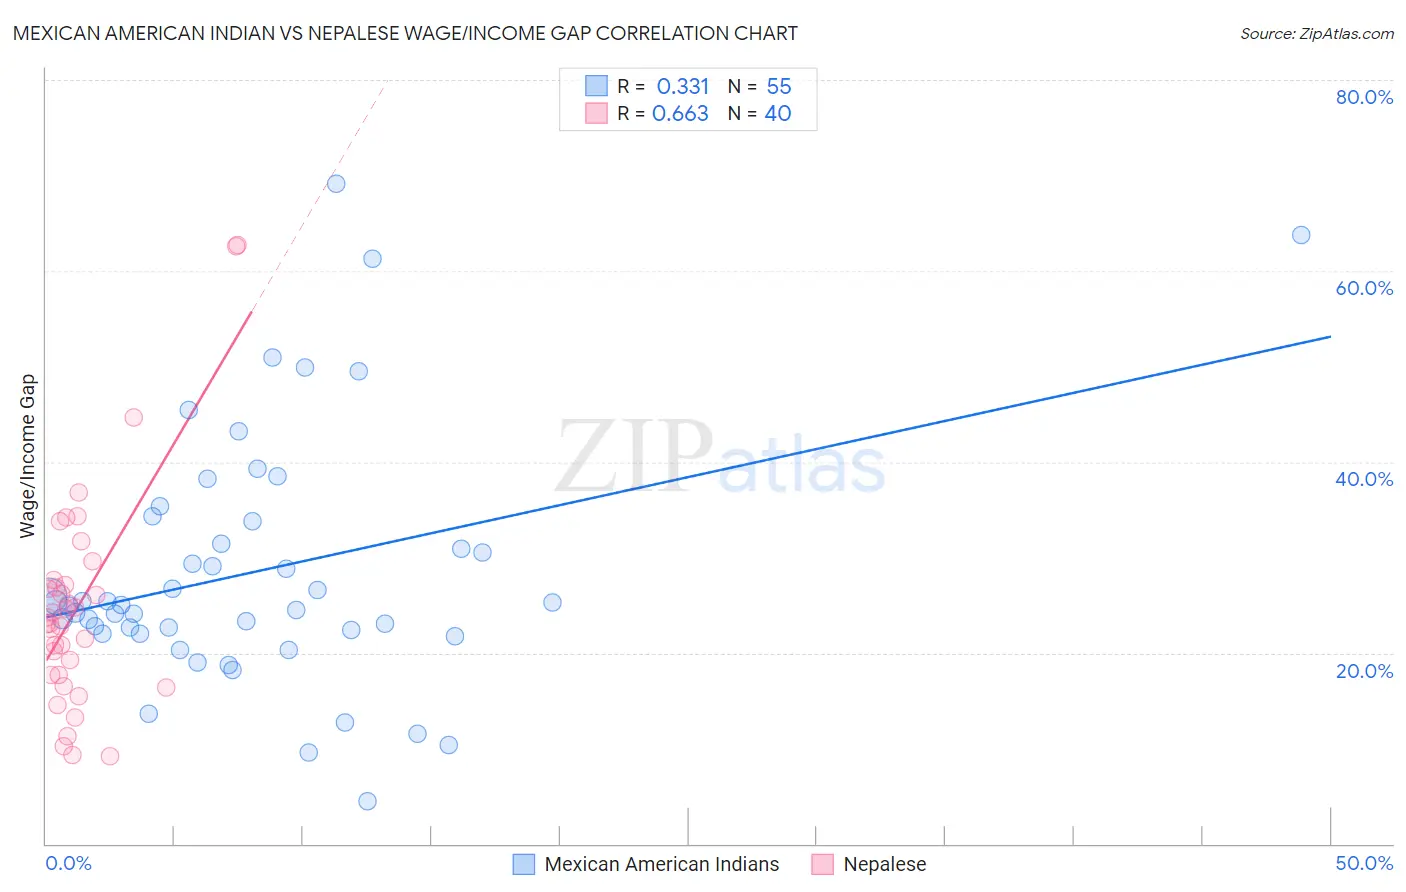
Mexican American Indian vs Nepalese Wage/Income Gap Correlation Chart
The statistical analysis conducted on geographies consisting of 317,413,111 people shows a mild positive correlation between the proportion of Mexican American Indians and wage/income gap percentage in the United States with a correlation coefficient (R) of 0.331 and weighted average of 24.7%. Similarly, the statistical analysis conducted on geographies consisting of 24,519,153 people shows a significant positive correlation between the proportion of Nepalese and wage/income gap percentage in the United States with a correlation coefficient (R) of 0.663 and weighted average of 22.2%, a difference of 11.3%.
Wage/Income Gap Correlation Summary
| Measurement | Mexican American Indian | Nepalese |
| Minimum | 4.5% | 9.1% |
| Maximum | 69.1% | 62.8% |
| Range | 64.7% | 53.7% |
| Mean | 28.5% | 25.0% |
| Median | 25.0% | 23.4% |
| Interquartile 25% (IQ1) | 22.0% | 17.7% |
| Interquartile 75% (IQ3) | 33.7% | 27.4% |
| Interquartile Range (IQR) | 11.7% | 9.7% |
| Standard Deviation (Sample) | 13.1% | 11.7% |
| Standard Deviation (Population) | 13.0% | 11.5% |
Similar Demographics by Wage/Income Gap
Demographics Similar to Mexican American Indians by Wage/Income Gap
In terms of wage/income gap, the demographic groups most similar to Mexican American Indians are Colombian (24.7%, a difference of 0.030%), Immigrants from Costa Rica (24.7%, a difference of 0.040%), South American Indian (24.7%, a difference of 0.060%), Immigrants from Philippines (24.7%, a difference of 0.19%), and Armenian (24.8%, a difference of 0.20%).
| Demographics | Rating | Rank | Wage/Income Gap |
| German Russians | 93.7 /100 | #127 | Exceptional 24.6% |
| Immigrants | Central America | 93.5 /100 | #128 | Exceptional 24.6% |
| Yup'ik | 93.3 /100 | #129 | Exceptional 24.7% |
| Alsatians | 93.2 /100 | #130 | Exceptional 24.7% |
| Immigrants | Philippines | 93.0 /100 | #131 | Exceptional 24.7% |
| Immigrants | Costa Rica | 92.4 /100 | #132 | Exceptional 24.7% |
| Colombians | 92.4 /100 | #133 | Exceptional 24.7% |
| Mexican American Indians | 92.2 /100 | #134 | Exceptional 24.7% |
| South American Indians | 92.0 /100 | #135 | Exceptional 24.7% |
| Armenians | 91.3 /100 | #136 | Exceptional 24.8% |
| Immigrants | South Eastern Asia | 90.9 /100 | #137 | Exceptional 24.8% |
| Immigrants | Bosnia and Herzegovina | 90.1 /100 | #138 | Exceptional 24.8% |
| Hispanics or Latinos | 89.5 /100 | #139 | Excellent 24.9% |
| Immigrants | Nepal | 89.3 /100 | #140 | Excellent 24.9% |
| Hawaiians | 89.3 /100 | #141 | Excellent 24.9% |
Demographics Similar to Nepalese by Wage/Income Gap
In terms of wage/income gap, the demographic groups most similar to Nepalese are Bangladeshi (22.2%, a difference of 0.23%), Immigrants from Cameroon (22.2%, a difference of 0.24%), Tohono O'odham (22.1%, a difference of 0.32%), Immigrants from Zaire (22.3%, a difference of 0.40%), and Immigrants from Ghana (22.3%, a difference of 0.43%).
| Demographics | Rating | Rank | Wage/Income Gap |
| Immigrants | Congo | 100.0 /100 | #47 | Exceptional 21.7% |
| Blacks/African Americans | 100.0 /100 | #48 | Exceptional 21.7% |
| Ethiopians | 100.0 /100 | #49 | Exceptional 21.8% |
| Immigrants | Western Africa | 100.0 /100 | #50 | Exceptional 22.0% |
| Tohono O'odham | 100.0 /100 | #51 | Exceptional 22.1% |
| Immigrants | Cameroon | 100.0 /100 | #52 | Exceptional 22.2% |
| Bangladeshis | 100.0 /100 | #53 | Exceptional 22.2% |
| Nepalese | 100.0 /100 | #54 | Exceptional 22.2% |
| Immigrants | Zaire | 100.0 /100 | #55 | Exceptional 22.3% |
| Immigrants | Ghana | 100.0 /100 | #56 | Exceptional 22.3% |
| Ghanaians | 100.0 /100 | #57 | Exceptional 22.3% |
| Immigrants | Cuba | 100.0 /100 | #58 | Exceptional 22.4% |
| Navajo | 100.0 /100 | #59 | Exceptional 22.4% |
| Immigrants | Middle Africa | 100.0 /100 | #60 | Exceptional 22.4% |
| Immigrants | Fiji | 100.0 /100 | #61 | Exceptional 22.4% |