Mongolian vs South American Indian Median Household Income
COMPARE
Mongolian
South American Indian
Median Household Income
Median Household Income Comparison
Mongolians
South American Indians
$93,971
MEDIAN HOUSEHOLD INCOME
99.7/ 100
METRIC RATING
68th/ 347
METRIC RANK
$87,446
MEDIAN HOUSEHOLD INCOME
81.8/ 100
METRIC RATING
147th/ 347
METRIC RANK
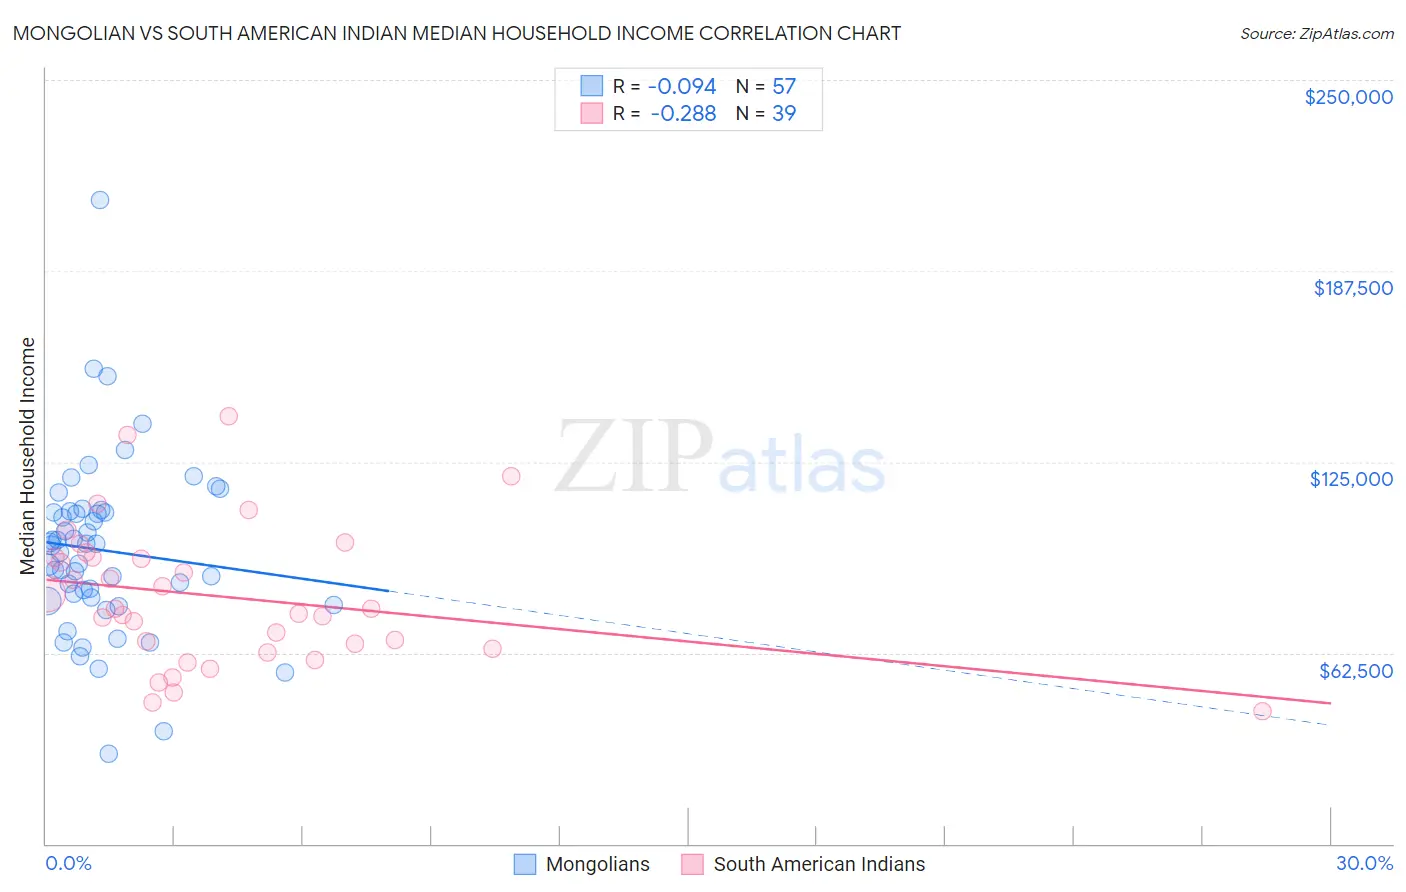
Mongolian vs South American Indian Median Household Income Correlation Chart
The statistical analysis conducted on geographies consisting of 140,276,403 people shows a slight negative correlation between the proportion of Mongolians and median household income in the United States with a correlation coefficient (R) of -0.094 and weighted average of $93,971. Similarly, the statistical analysis conducted on geographies consisting of 164,527,157 people shows a weak negative correlation between the proportion of South American Indians and median household income in the United States with a correlation coefficient (R) of -0.288 and weighted average of $87,446, a difference of 7.5%.
Median Household Income Correlation Summary
| Measurement | Mongolian | South American Indian |
| Minimum | $29,643 | $43,438 |
| Maximum | $210,785 | $140,082 |
| Range | $181,142 | $96,644 |
| Mean | $96,039 | $80,839 |
| Median | $97,648 | $76,875 |
| Interquartile 25% (IQ1) | $79,996 | $63,676 |
| Interquartile 75% (IQ3) | $108,680 | $93,892 |
| Interquartile Range (IQR) | $28,684 | $30,216 |
| Standard Deviation (Sample) | $28,830 | $22,835 |
| Standard Deviation (Population) | $28,576 | $22,540 |
Similar Demographics by Median Household Income
Demographics Similar to Mongolians by Median Household Income
In terms of median household income, the demographic groups most similar to Mongolians are Argentinean ($93,960, a difference of 0.010%), Immigrants from Fiji ($93,933, a difference of 0.040%), Immigrants from Philippines ($93,899, a difference of 0.080%), Immigrants from Scotland ($94,091, a difference of 0.13%), and Lithuanian ($93,852, a difference of 0.13%).
| Demographics | Rating | Rank | Median Household Income |
| Laotians | 99.8 /100 | #61 | Exceptional $94,990 |
| Immigrants | Norway | 99.8 /100 | #62 | Exceptional $94,846 |
| Greeks | 99.8 /100 | #63 | Exceptional $94,735 |
| Immigrants | Netherlands | 99.7 /100 | #64 | Exceptional $94,411 |
| Immigrants | Belarus | 99.7 /100 | #65 | Exceptional $94,399 |
| Immigrants | Romania | 99.7 /100 | #66 | Exceptional $94,222 |
| Immigrants | Scotland | 99.7 /100 | #67 | Exceptional $94,091 |
| Mongolians | 99.7 /100 | #68 | Exceptional $93,971 |
| Argentineans | 99.7 /100 | #69 | Exceptional $93,960 |
| Immigrants | Fiji | 99.7 /100 | #70 | Exceptional $93,933 |
| Immigrants | Philippines | 99.6 /100 | #71 | Exceptional $93,899 |
| Lithuanians | 99.6 /100 | #72 | Exceptional $93,852 |
| Immigrants | Egypt | 99.6 /100 | #73 | Exceptional $93,700 |
| Immigrants | Latvia | 99.6 /100 | #74 | Exceptional $93,602 |
| Immigrants | Italy | 99.5 /100 | #75 | Exceptional $93,465 |
Demographics Similar to South American Indians by Median Household Income
In terms of median household income, the demographic groups most similar to South American Indians are Immigrants from Uganda ($87,553, a difference of 0.12%), Ugandan ($87,557, a difference of 0.13%), Serbian ($87,572, a difference of 0.14%), Costa Rican ($87,262, a difference of 0.21%), and Danish ($87,676, a difference of 0.26%).
| Demographics | Rating | Rank | Median Household Income |
| Lebanese | 87.2 /100 | #140 | Excellent $88,091 |
| Immigrants | Morocco | 86.0 /100 | #141 | Excellent $87,930 |
| Canadians | 84.7 /100 | #142 | Excellent $87,769 |
| Danes | 83.9 /100 | #143 | Excellent $87,676 |
| Serbians | 83.0 /100 | #144 | Excellent $87,572 |
| Ugandans | 82.9 /100 | #145 | Excellent $87,557 |
| Immigrants | Uganda | 82.8 /100 | #146 | Excellent $87,553 |
| South American Indians | 81.8 /100 | #147 | Excellent $87,446 |
| Costa Ricans | 80.0 /100 | #148 | Excellent $87,262 |
| Immigrants | Nepal | 77.7 /100 | #149 | Good $87,046 |
| Basques | 77.2 /100 | #150 | Good $87,001 |
| Hungarians | 76.3 /100 | #151 | Good $86,920 |
| Immigrants | Saudi Arabia | 75.8 /100 | #152 | Good $86,875 |
| South Americans | 75.1 /100 | #153 | Good $86,824 |
| Immigrants | Germany | 74.4 /100 | #154 | Good $86,764 |