Moroccan vs Immigrants from Poland Median Male Earnings
COMPARE
Moroccan
Immigrants from Poland
Median Male Earnings
Median Male Earnings Comparison
Moroccans
Immigrants from Poland
$56,499
MEDIAN MALE EARNINGS
87.7/ 100
METRIC RATING
134th/ 347
METRIC RANK
$58,452
MEDIAN MALE EARNINGS
98.0/ 100
METRIC RATING
99th/ 347
METRIC RANK
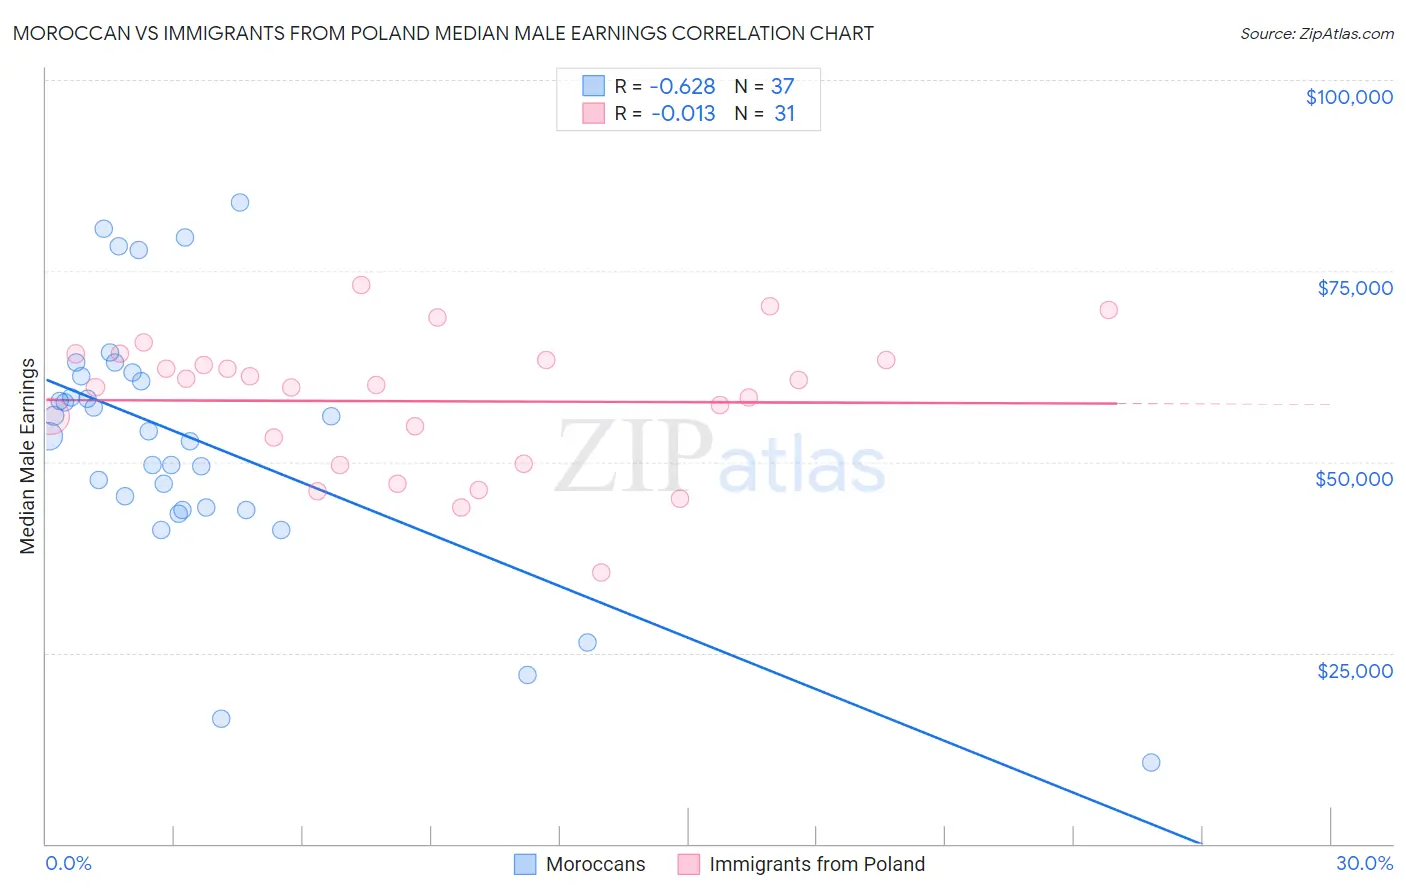
Moroccan vs Immigrants from Poland Median Male Earnings Correlation Chart
The statistical analysis conducted on geographies consisting of 201,785,575 people shows a significant negative correlation between the proportion of Moroccans and median male earnings in the United States with a correlation coefficient (R) of -0.628 and weighted average of $56,499. Similarly, the statistical analysis conducted on geographies consisting of 304,780,508 people shows no correlation between the proportion of Immigrants from Poland and median male earnings in the United States with a correlation coefficient (R) of -0.013 and weighted average of $58,452, a difference of 3.5%.
Median Male Earnings Correlation Summary
| Measurement | Moroccan | Immigrants from Poland |
| Minimum | $10,662 | $35,574 |
| Maximum | $84,023 | $73,128 |
| Range | $73,361 | $37,554 |
| Mean | $52,885 | $57,933 |
| Median | $54,008 | $60,075 |
| Interquartile 25% (IQ1) | $43,924 | $49,798 |
| Interquartile 75% (IQ3) | $61,434 | $63,413 |
| Interquartile Range (IQR) | $17,511 | $13,615 |
| Standard Deviation (Sample) | $16,590 | $8,867 |
| Standard Deviation (Population) | $16,364 | $8,722 |
Similar Demographics by Median Male Earnings
Demographics Similar to Moroccans by Median Male Earnings
In terms of median male earnings, the demographic groups most similar to Moroccans are Irish ($56,464, a difference of 0.060%), Czech ($56,546, a difference of 0.080%), Immigrants from Germany ($56,542, a difference of 0.080%), Immigrants from Saudi Arabia ($56,452, a difference of 0.080%), and Slavic ($56,390, a difference of 0.19%).
| Demographics | Rating | Rank | Median Male Earnings |
| Brazilians | 90.9 /100 | #127 | Exceptional $56,837 |
| Immigrants | Syria | 90.8 /100 | #128 | Exceptional $56,830 |
| Pakistanis | 89.9 /100 | #129 | Excellent $56,719 |
| Koreans | 89.4 /100 | #130 | Excellent $56,672 |
| Portuguese | 89.4 /100 | #131 | Excellent $56,663 |
| Czechs | 88.2 /100 | #132 | Excellent $56,546 |
| Immigrants | Germany | 88.2 /100 | #133 | Excellent $56,542 |
| Moroccans | 87.7 /100 | #134 | Excellent $56,499 |
| Irish | 87.4 /100 | #135 | Excellent $56,464 |
| Immigrants | Saudi Arabia | 87.2 /100 | #136 | Excellent $56,452 |
| Slavs | 86.5 /100 | #137 | Excellent $56,390 |
| Slovaks | 85.5 /100 | #138 | Excellent $56,306 |
| Zimbabweans | 85.5 /100 | #139 | Excellent $56,302 |
| Luxembourgers | 85.5 /100 | #140 | Excellent $56,300 |
| Danes | 84.8 /100 | #141 | Excellent $56,246 |
Demographics Similar to Immigrants from Poland by Median Male Earnings
In terms of median male earnings, the demographic groups most similar to Immigrants from Poland are Assyrian/Chaldean/Syriac ($58,437, a difference of 0.030%), Jordanian ($58,500, a difference of 0.080%), Immigrants from Brazil ($58,324, a difference of 0.22%), Northern European ($58,588, a difference of 0.23%), and Albanian ($58,680, a difference of 0.39%).
| Demographics | Rating | Rank | Median Male Earnings |
| Immigrants | Kazakhstan | 99.1 /100 | #92 | Exceptional $59,278 |
| Immigrants | Southern Europe | 99.0 /100 | #93 | Exceptional $59,217 |
| Immigrants | North Macedonia | 99.0 /100 | #94 | Exceptional $59,189 |
| Immigrants | Lebanon | 98.6 /100 | #95 | Exceptional $58,835 |
| Albanians | 98.4 /100 | #96 | Exceptional $58,680 |
| Northern Europeans | 98.2 /100 | #97 | Exceptional $58,588 |
| Jordanians | 98.1 /100 | #98 | Exceptional $58,500 |
| Immigrants | Poland | 98.0 /100 | #99 | Exceptional $58,452 |
| Assyrians/Chaldeans/Syriacs | 97.9 /100 | #100 | Exceptional $58,437 |
| Immigrants | Brazil | 97.7 /100 | #101 | Exceptional $58,324 |
| Syrians | 97.4 /100 | #102 | Exceptional $58,187 |
| Poles | 97.3 /100 | #103 | Exceptional $58,139 |
| Armenians | 97.3 /100 | #104 | Exceptional $58,134 |
| Immigrants | Western Asia | 97.3 /100 | #105 | Exceptional $58,131 |
| Immigrants | Northern Africa | 96.9 /100 | #106 | Exceptional $58,008 |