Nigerian vs Immigrants from the Azores Householder Income Ages 25 - 44 years
COMPARE
Nigerian
Immigrants from the Azores
Householder Income Ages 25 - 44 years
Householder Income Ages 25 - 44 years Comparison
Nigerians
Immigrants from the Azores
$87,730
HOUSEHOLDER INCOME AGES 25 - 44 YEARS
2.2/ 100
METRIC RATING
241st/ 347
METRIC RANK
$92,322
HOUSEHOLDER INCOME AGES 25 - 44 YEARS
22.4/ 100
METRIC RATING
194th/ 347
METRIC RANK
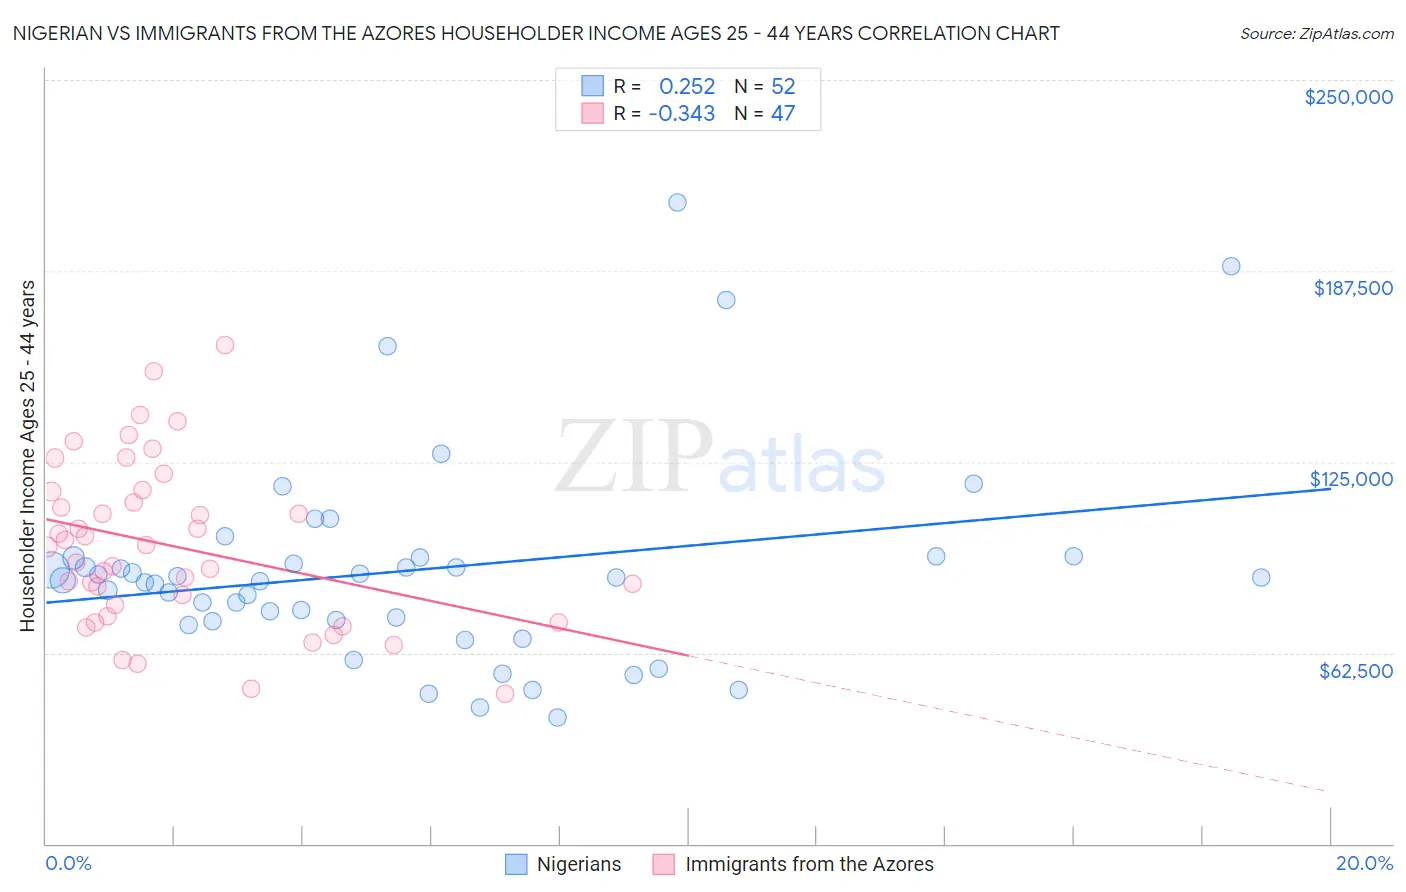
Nigerian vs Immigrants from the Azores Householder Income Ages 25 - 44 years Correlation Chart
The statistical analysis conducted on geographies consisting of 332,006,282 people shows a weak positive correlation between the proportion of Nigerians and household income with householder between the ages 25 and 44 in the United States with a correlation coefficient (R) of 0.252 and weighted average of $87,730. Similarly, the statistical analysis conducted on geographies consisting of 46,239,396 people shows a mild negative correlation between the proportion of Immigrants from the Azores and household income with householder between the ages 25 and 44 in the United States with a correlation coefficient (R) of -0.343 and weighted average of $92,322, a difference of 5.2%.
Householder Income Ages 25 - 44 years Correlation Summary
| Measurement | Nigerian | Immigrants from the Azores |
| Minimum | $41,500 | $48,897 |
| Maximum | $210,089 | $163,387 |
| Range | $168,589 | $114,490 |
| Mean | $89,439 | $97,325 |
| Median | $86,690 | $97,135 |
| Interquartile 25% (IQ1) | $73,174 | $74,519 |
| Interquartile 75% (IQ3) | $93,591 | $115,346 |
| Interquartile Range (IQR) | $20,417 | $40,827 |
| Standard Deviation (Sample) | $33,605 | $26,928 |
| Standard Deviation (Population) | $33,281 | $26,640 |
Similar Demographics by Householder Income Ages 25 - 44 years
Demographics Similar to Nigerians by Householder Income Ages 25 - 44 years
In terms of householder income ages 25 - 44 years, the demographic groups most similar to Nigerians are Nicaraguan ($87,751, a difference of 0.020%), Immigrants from Ghana ($87,760, a difference of 0.030%), Alaska Native ($88,018, a difference of 0.33%), Salvadoran ($88,198, a difference of 0.53%), and Immigrants from Cameroon ($88,214, a difference of 0.55%).
| Demographics | Rating | Rank | Householder Income Ages 25 - 44 years |
| Venezuelans | 2.9 /100 | #234 | Tragic $88,232 |
| Bermudans | 2.9 /100 | #235 | Tragic $88,231 |
| Immigrants | Cameroon | 2.9 /100 | #236 | Tragic $88,214 |
| Salvadorans | 2.8 /100 | #237 | Tragic $88,198 |
| Alaska Natives | 2.6 /100 | #238 | Tragic $88,018 |
| Immigrants | Ghana | 2.2 /100 | #239 | Tragic $87,760 |
| Nicaraguans | 2.2 /100 | #240 | Tragic $87,751 |
| Nigerians | 2.2 /100 | #241 | Tragic $87,730 |
| West Indians | 1.7 /100 | #242 | Tragic $87,205 |
| Immigrants | West Indies | 1.5 /100 | #243 | Tragic $87,063 |
| Immigrants | Venezuela | 1.5 /100 | #244 | Tragic $87,038 |
| Immigrants | El Salvador | 1.4 /100 | #245 | Tragic $86,913 |
| Immigrants | Burma/Myanmar | 1.3 /100 | #246 | Tragic $86,736 |
| Immigrants | Nigeria | 1.2 /100 | #247 | Tragic $86,589 |
| Immigrants | Sudan | 0.9 /100 | #248 | Tragic $86,109 |
Demographics Similar to Immigrants from the Azores by Householder Income Ages 25 - 44 years
In terms of householder income ages 25 - 44 years, the demographic groups most similar to Immigrants from the Azores are Samoan ($92,385, a difference of 0.070%), Celtic ($92,241, a difference of 0.090%), Immigrants from Colombia ($92,204, a difference of 0.13%), Spanish ($92,200, a difference of 0.13%), and Vietnamese ($92,089, a difference of 0.25%).
| Demographics | Rating | Rank | Householder Income Ages 25 - 44 years |
| Spaniards | 34.0 /100 | #187 | Fair $93,366 |
| Immigrants | Sierra Leone | 30.9 /100 | #188 | Fair $93,115 |
| Dutch | 30.5 /100 | #189 | Fair $93,081 |
| Welsh | 30.0 /100 | #190 | Fair $93,039 |
| Tlingit-Haida | 29.4 /100 | #191 | Fair $92,987 |
| Immigrants | Costa Rica | 28.2 /100 | #192 | Fair $92,876 |
| Samoans | 23.0 /100 | #193 | Fair $92,385 |
| Immigrants | Azores | 22.4 /100 | #194 | Fair $92,322 |
| Celtics | 21.6 /100 | #195 | Fair $92,241 |
| Immigrants | Colombia | 21.3 /100 | #196 | Fair $92,204 |
| Spanish | 21.2 /100 | #197 | Fair $92,200 |
| Vietnamese | 20.2 /100 | #198 | Fair $92,089 |
| Kenyans | 16.8 /100 | #199 | Poor $91,684 |
| Whites/Caucasians | 16.7 /100 | #200 | Poor $91,668 |
| Japanese | 16.4 /100 | #201 | Poor $91,624 |