Northern European vs Luxembourger Householder Income Ages 25 - 44 years
COMPARE
Northern European
Luxembourger
Householder Income Ages 25 - 44 years
Householder Income Ages 25 - 44 years Comparison
Northern Europeans
Luxembourgers
$100,457
HOUSEHOLDER INCOME AGES 25 - 44 YEARS
96.3/ 100
METRIC RATING
107th/ 347
METRIC RANK
$97,237
HOUSEHOLDER INCOME AGES 25 - 44 YEARS
81.5/ 100
METRIC RATING
141st/ 347
METRIC RANK
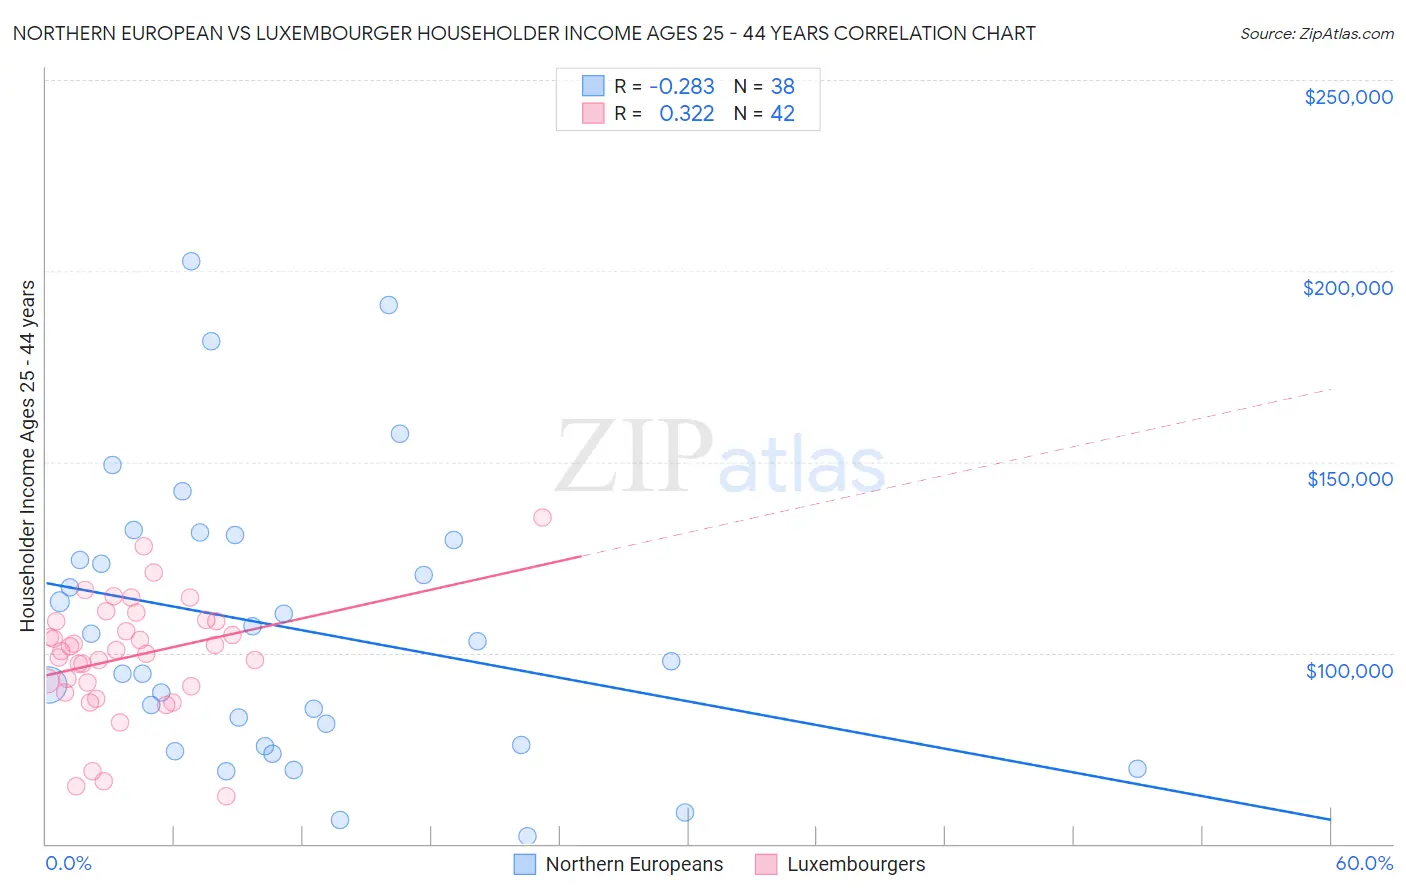
Northern European vs Luxembourger Householder Income Ages 25 - 44 years Correlation Chart
The statistical analysis conducted on geographies consisting of 404,748,237 people shows a weak negative correlation between the proportion of Northern Europeans and household income with householder between the ages 25 and 44 in the United States with a correlation coefficient (R) of -0.283 and weighted average of $100,457. Similarly, the statistical analysis conducted on geographies consisting of 144,399,527 people shows a mild positive correlation between the proportion of Luxembourgers and household income with householder between the ages 25 and 44 in the United States with a correlation coefficient (R) of 0.322 and weighted average of $97,237, a difference of 3.3%.
Householder Income Ages 25 - 44 years Correlation Summary
| Measurement | Northern European | Luxembourger |
| Minimum | $51,817 | $62,500 |
| Maximum | $202,571 | $135,353 |
| Range | $150,754 | $72,853 |
| Mean | $106,570 | $99,089 |
| Median | $100,458 | $100,624 |
| Interquartile 25% (IQ1) | $75,848 | $91,375 |
| Interquartile 75% (IQ3) | $129,485 | $108,286 |
| Interquartile Range (IQR) | $53,637 | $16,911 |
| Standard Deviation (Sample) | $36,774 | $15,610 |
| Standard Deviation (Population) | $36,287 | $15,424 |
Similar Demographics by Householder Income Ages 25 - 44 years
Demographics Similar to Northern Europeans by Householder Income Ages 25 - 44 years
In terms of householder income ages 25 - 44 years, the demographic groups most similar to Northern Europeans are Immigrants from Vietnam ($100,535, a difference of 0.080%), Immigrants from Brazil ($100,534, a difference of 0.080%), Immigrants from South Eastern Asia ($100,283, a difference of 0.17%), Immigrants from North Macedonia ($100,101, a difference of 0.36%), and Immigrants from Afghanistan ($99,977, a difference of 0.48%).
| Demographics | Rating | Rank | Householder Income Ages 25 - 44 years |
| Immigrants | Argentina | 97.8 /100 | #100 | Exceptional $101,415 |
| Albanians | 97.8 /100 | #101 | Exceptional $101,367 |
| Immigrants | Lebanon | 97.4 /100 | #102 | Exceptional $101,124 |
| Immigrants | Moldova | 97.4 /100 | #103 | Exceptional $101,091 |
| Immigrants | Poland | 97.4 /100 | #104 | Exceptional $101,065 |
| Immigrants | Vietnam | 96.5 /100 | #105 | Exceptional $100,535 |
| Immigrants | Brazil | 96.5 /100 | #106 | Exceptional $100,534 |
| Northern Europeans | 96.3 /100 | #107 | Exceptional $100,457 |
| Immigrants | South Eastern Asia | 96.0 /100 | #108 | Exceptional $100,283 |
| Immigrants | North Macedonia | 95.6 /100 | #109 | Exceptional $100,101 |
| Immigrants | Afghanistan | 95.3 /100 | #110 | Exceptional $99,977 |
| Chileans | 95.1 /100 | #111 | Exceptional $99,900 |
| Poles | 94.5 /100 | #112 | Exceptional $99,685 |
| Tongans | 94.2 /100 | #113 | Exceptional $99,604 |
| Immigrants | Western Asia | 94.0 /100 | #114 | Exceptional $99,516 |
Demographics Similar to Luxembourgers by Householder Income Ages 25 - 44 years
In terms of householder income ages 25 - 44 years, the demographic groups most similar to Luxembourgers are Danish ($97,221, a difference of 0.020%), Immigrants from Jordan ($97,185, a difference of 0.050%), Immigrants from Morocco ($97,305, a difference of 0.070%), Immigrants from Chile ($97,159, a difference of 0.080%), and Immigrants from Peru ($97,329, a difference of 0.090%).
| Demographics | Rating | Rank | Householder Income Ages 25 - 44 years |
| Canadians | 84.5 /100 | #134 | Excellent $97,625 |
| Immigrants | Oceania | 84.5 /100 | #135 | Excellent $97,623 |
| Hungarians | 83.9 /100 | #136 | Excellent $97,544 |
| Lebanese | 82.3 /100 | #137 | Excellent $97,339 |
| Arabs | 82.3 /100 | #138 | Excellent $97,336 |
| Immigrants | Peru | 82.2 /100 | #139 | Excellent $97,329 |
| Immigrants | Morocco | 82.0 /100 | #140 | Excellent $97,305 |
| Luxembourgers | 81.5 /100 | #141 | Excellent $97,237 |
| Danes | 81.3 /100 | #142 | Excellent $97,221 |
| Immigrants | Jordan | 81.0 /100 | #143 | Excellent $97,185 |
| Immigrants | Chile | 80.8 /100 | #144 | Excellent $97,159 |
| Norwegians | 78.2 /100 | #145 | Good $96,866 |
| Ethiopians | 77.8 /100 | #146 | Good $96,824 |
| Immigrants | Syria | 77.4 /100 | #147 | Good $96,789 |
| Irish | 76.9 /100 | #148 | Good $96,730 |