Pakistani vs Bangladeshi Per Capita Income
COMPARE
Pakistani
Bangladeshi
Per Capita Income
Per Capita Income Comparison
Pakistanis
Bangladeshis
$45,587
PER CAPITA INCOME
89.7/ 100
METRIC RATING
133rd/ 347
METRIC RANK
$35,897
PER CAPITA INCOME
0.0/ 100
METRIC RATING
318th/ 347
METRIC RANK
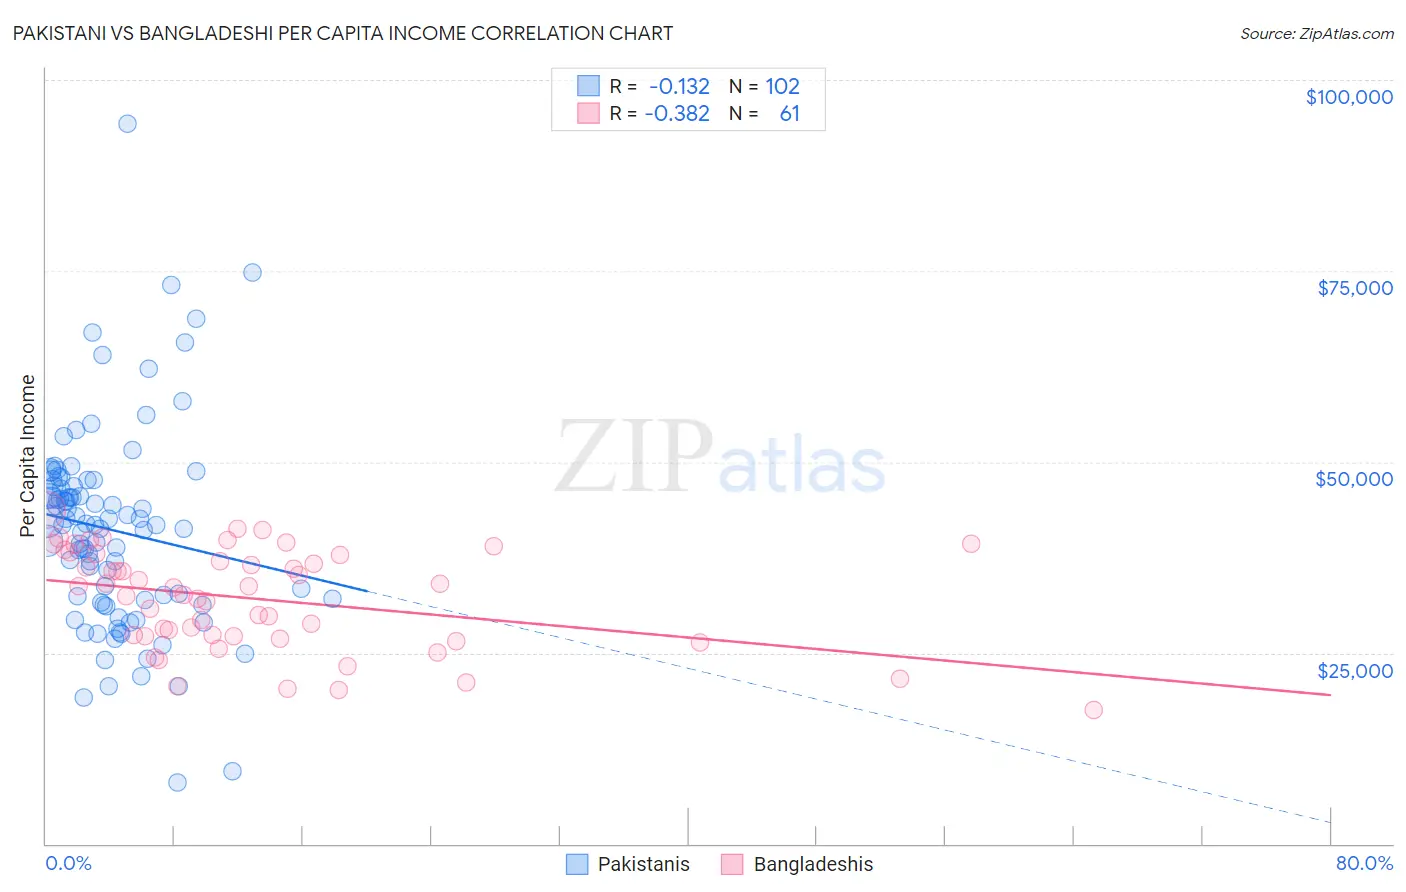
Pakistani vs Bangladeshi Per Capita Income Correlation Chart
The statistical analysis conducted on geographies consisting of 335,371,609 people shows a poor negative correlation between the proportion of Pakistanis and per capita income in the United States with a correlation coefficient (R) of -0.132 and weighted average of $45,587. Similarly, the statistical analysis conducted on geographies consisting of 141,454,199 people shows a mild negative correlation between the proportion of Bangladeshis and per capita income in the United States with a correlation coefficient (R) of -0.382 and weighted average of $35,897, a difference of 27.0%.
Per Capita Income Correlation Summary
| Measurement | Pakistani | Bangladeshi |
| Minimum | $8,026 | $17,577 |
| Maximum | $94,275 | $43,772 |
| Range | $86,249 | $26,195 |
| Mean | $41,080 | $32,070 |
| Median | $41,744 | $33,478 |
| Interquartile 25% (IQ1) | $31,965 | $27,131 |
| Interquartile 75% (IQ3) | $46,855 | $37,833 |
| Interquartile Range (IQR) | $14,890 | $10,702 |
| Standard Deviation (Sample) | $13,251 | $6,476 |
| Standard Deviation (Population) | $13,186 | $6,423 |
Similar Demographics by Per Capita Income
Demographics Similar to Pakistanis by Per Capita Income
In terms of per capita income, the demographic groups most similar to Pakistanis are Slovene ($45,581, a difference of 0.010%), Jordanian ($45,605, a difference of 0.040%), Immigrants from North Macedonia ($45,622, a difference of 0.080%), Arab ($45,662, a difference of 0.16%), and Luxembourger ($45,663, a difference of 0.17%).
| Demographics | Rating | Rank | Per Capita Income |
| Palestinians | 91.6 /100 | #126 | Exceptional $45,790 |
| Immigrants | Germany | 91.3 /100 | #127 | Exceptional $45,751 |
| Swedes | 91.3 /100 | #128 | Exceptional $45,750 |
| Luxembourgers | 90.4 /100 | #129 | Exceptional $45,663 |
| Arabs | 90.4 /100 | #130 | Exceptional $45,662 |
| Immigrants | North Macedonia | 90.0 /100 | #131 | Exceptional $45,622 |
| Jordanians | 89.9 /100 | #132 | Excellent $45,605 |
| Pakistanis | 89.7 /100 | #133 | Excellent $45,587 |
| Slovenes | 89.6 /100 | #134 | Excellent $45,581 |
| Hungarians | 87.9 /100 | #135 | Excellent $45,426 |
| Immigrants | Oceania | 85.2 /100 | #136 | Excellent $45,220 |
| Immigrants | Syria | 85.2 /100 | #137 | Excellent $45,218 |
| Assyrians/Chaldeans/Syriacs | 84.8 /100 | #138 | Excellent $45,195 |
| Basques | 83.2 /100 | #139 | Excellent $45,086 |
| Immigrants | Jordan | 82.9 /100 | #140 | Excellent $45,066 |
Demographics Similar to Bangladeshis by Per Capita Income
In terms of per capita income, the demographic groups most similar to Bangladeshis are Dutch West Indian ($35,922, a difference of 0.070%), Choctaw ($35,999, a difference of 0.28%), Immigrants from Congo ($35,720, a difference of 0.50%), Hispanic or Latino ($35,688, a difference of 0.59%), and Yaqui ($36,112, a difference of 0.60%).
| Demographics | Rating | Rank | Per Capita Income |
| Chippewa | 0.0 /100 | #311 | Tragic $36,631 |
| Chickasaw | 0.0 /100 | #312 | Tragic $36,475 |
| Bahamians | 0.0 /100 | #313 | Tragic $36,427 |
| Seminole | 0.0 /100 | #314 | Tragic $36,180 |
| Yaqui | 0.0 /100 | #315 | Tragic $36,112 |
| Choctaw | 0.0 /100 | #316 | Tragic $35,999 |
| Dutch West Indians | 0.0 /100 | #317 | Tragic $35,922 |
| Bangladeshis | 0.0 /100 | #318 | Tragic $35,897 |
| Immigrants | Congo | 0.0 /100 | #319 | Tragic $35,720 |
| Hispanics or Latinos | 0.0 /100 | #320 | Tragic $35,688 |
| Blacks/African Americans | 0.0 /100 | #321 | Tragic $35,564 |
| Creek | 0.0 /100 | #322 | Tragic $35,546 |
| Cheyenne | 0.0 /100 | #323 | Tragic $35,276 |
| Kiowa | 0.0 /100 | #324 | Tragic $35,102 |
| Immigrants | Central America | 0.0 /100 | #325 | Tragic $34,974 |