Pakistani vs Kiowa Median Family Income
COMPARE
Pakistani
Kiowa
Median Family Income
Median Family Income Comparison
Pakistanis
Kiowa
$107,390
MEDIAN FAMILY INCOME
91.7/ 100
METRIC RATING
124th/ 347
METRIC RANK
$80,885
MEDIAN FAMILY INCOME
0.0/ 100
METRIC RATING
333rd/ 347
METRIC RANK
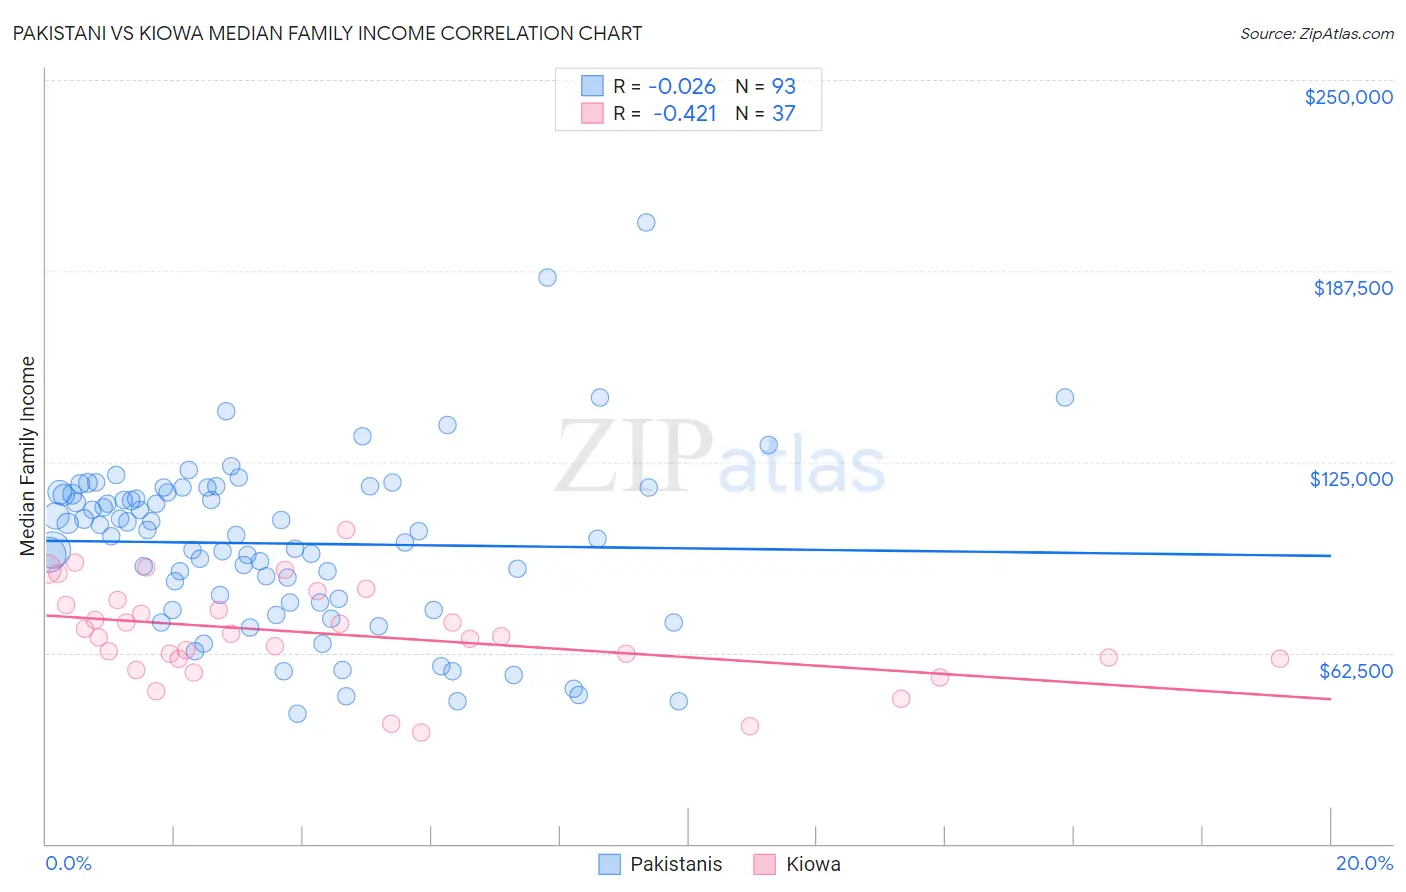
Pakistani vs Kiowa Median Family Income Correlation Chart
The statistical analysis conducted on geographies consisting of 335,122,769 people shows no correlation between the proportion of Pakistanis and median family income in the United States with a correlation coefficient (R) of -0.026 and weighted average of $107,390. Similarly, the statistical analysis conducted on geographies consisting of 56,095,481 people shows a moderate negative correlation between the proportion of Kiowa and median family income in the United States with a correlation coefficient (R) of -0.421 and weighted average of $80,885, a difference of 32.8%.
Median Family Income Correlation Summary
| Measurement | Pakistani | Kiowa |
| Minimum | $42,414 | $36,250 |
| Maximum | $203,281 | $102,708 |
| Range | $160,867 | $66,458 |
| Mean | $98,287 | $68,555 |
| Median | $101,250 | $67,750 |
| Interquartile 25% (IQ1) | $78,908 | $60,573 |
| Interquartile 75% (IQ3) | $114,990 | $79,021 |
| Interquartile Range (IQR) | $36,082 | $18,448 |
| Standard Deviation (Sample) | $28,141 | $15,572 |
| Standard Deviation (Population) | $27,989 | $15,360 |
Similar Demographics by Median Family Income
Demographics Similar to Pakistanis by Median Family Income
In terms of median family income, the demographic groups most similar to Pakistanis are Taiwanese ($107,295, a difference of 0.090%), Carpatho Rusyn ($107,502, a difference of 0.11%), Serbian ($107,157, a difference of 0.22%), Lebanese ($107,086, a difference of 0.28%), and Immigrants from Jordan ($107,715, a difference of 0.30%).
| Demographics | Rating | Rank | Median Family Income |
| Immigrants | Philippines | 94.6 /100 | #117 | Exceptional $108,288 |
| Ethiopians | 94.5 /100 | #118 | Exceptional $108,251 |
| Sri Lankans | 94.5 /100 | #119 | Exceptional $108,234 |
| Immigrants | Northern Africa | 94.3 /100 | #120 | Exceptional $108,161 |
| Europeans | 94.1 /100 | #121 | Exceptional $108,099 |
| Immigrants | Jordan | 92.9 /100 | #122 | Exceptional $107,715 |
| Carpatho Rusyns | 92.2 /100 | #123 | Exceptional $107,502 |
| Pakistanis | 91.7 /100 | #124 | Exceptional $107,390 |
| Taiwanese | 91.4 /100 | #125 | Exceptional $107,295 |
| Serbians | 90.8 /100 | #126 | Exceptional $107,157 |
| Lebanese | 90.5 /100 | #127 | Exceptional $107,086 |
| Immigrants | Ethiopia | 90.0 /100 | #128 | Excellent $106,969 |
| Arabs | 89.9 /100 | #129 | Excellent $106,952 |
| Brazilians | 89.8 /100 | #130 | Excellent $106,942 |
| Canadians | 88.1 /100 | #131 | Excellent $106,597 |
Demographics Similar to Kiowa by Median Family Income
In terms of median family income, the demographic groups most similar to Kiowa are Native/Alaskan ($80,908, a difference of 0.030%), Immigrants from Dominican Republic ($81,233, a difference of 0.43%), Cheyenne ($81,385, a difference of 0.62%), Dutch West Indian ($81,852, a difference of 1.2%), and Black/African American ($81,912, a difference of 1.3%).
| Demographics | Rating | Rank | Median Family Income |
| Immigrants | Congo | 0.0 /100 | #326 | Tragic $82,216 |
| Arapaho | 0.0 /100 | #327 | Tragic $82,064 |
| Blacks/African Americans | 0.0 /100 | #328 | Tragic $81,912 |
| Dutch West Indians | 0.0 /100 | #329 | Tragic $81,852 |
| Cheyenne | 0.0 /100 | #330 | Tragic $81,385 |
| Immigrants | Dominican Republic | 0.0 /100 | #331 | Tragic $81,233 |
| Natives/Alaskans | 0.0 /100 | #332 | Tragic $80,908 |
| Kiowa | 0.0 /100 | #333 | Tragic $80,885 |
| Menominee | 0.0 /100 | #334 | Tragic $79,563 |
| Yup'ik | 0.0 /100 | #335 | Tragic $79,290 |
| Immigrants | Cuba | 0.0 /100 | #336 | Tragic $78,249 |
| Yuman | 0.0 /100 | #337 | Tragic $78,055 |
| Immigrants | Yemen | 0.0 /100 | #338 | Tragic $77,457 |
| Pima | 0.0 /100 | #339 | Tragic $77,431 |
| Hopi | 0.0 /100 | #340 | Tragic $77,188 |