Pakistani vs Spanish American Householder Income Ages 45 - 64 years
COMPARE
Pakistani
Spanish American
Householder Income Ages 45 - 64 years
Householder Income Ages 45 - 64 years Comparison
Pakistanis
Spanish Americans
$105,317
HOUSEHOLDER INCOME AGES 45 - 64 YEARS
92.4/ 100
METRIC RATING
125th/ 347
METRIC RANK
$87,836
HOUSEHOLDER INCOME AGES 45 - 64 YEARS
0.2/ 100
METRIC RATING
269th/ 347
METRIC RANK
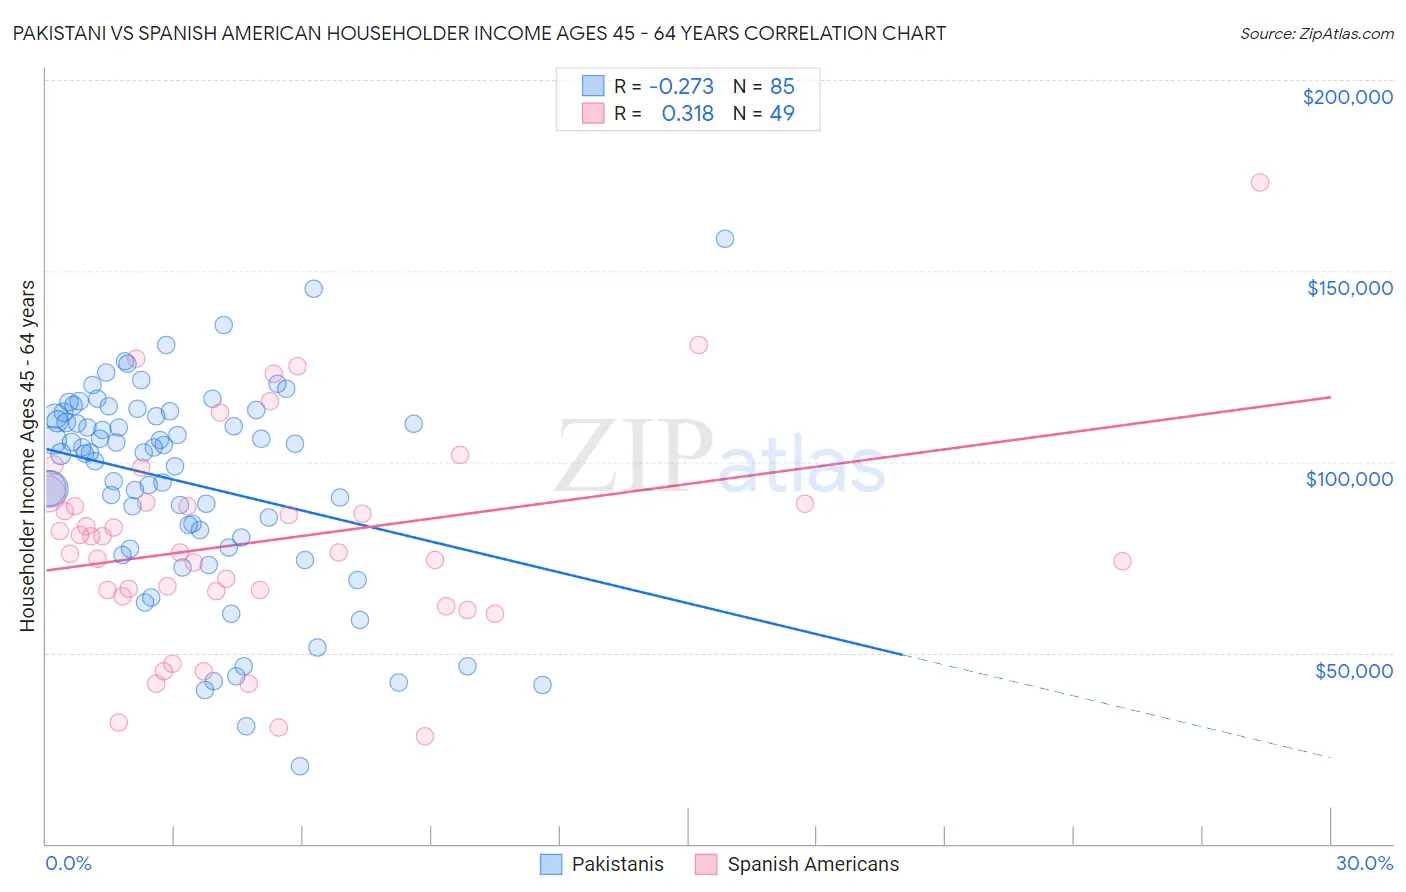
Pakistani vs Spanish American Householder Income Ages 45 - 64 years Correlation Chart
The statistical analysis conducted on geographies consisting of 334,898,404 people shows a weak negative correlation between the proportion of Pakistanis and household income with householder between the ages 45 and 64 in the United States with a correlation coefficient (R) of -0.273 and weighted average of $105,317. Similarly, the statistical analysis conducted on geographies consisting of 103,142,376 people shows a mild positive correlation between the proportion of Spanish Americans and household income with householder between the ages 45 and 64 in the United States with a correlation coefficient (R) of 0.318 and weighted average of $87,836, a difference of 19.9%.
Householder Income Ages 45 - 64 years Correlation Summary
| Measurement | Pakistani | Spanish American |
| Minimum | $20,167 | $28,021 |
| Maximum | $158,417 | $173,295 |
| Range | $138,250 | $145,274 |
| Mean | $94,559 | $79,401 |
| Median | $102,574 | $76,250 |
| Interquartile 25% (IQ1) | $78,855 | $65,439 |
| Interquartile 75% (IQ3) | $112,512 | $89,172 |
| Interquartile Range (IQR) | $33,657 | $23,734 |
| Standard Deviation (Sample) | $26,997 | $28,080 |
| Standard Deviation (Population) | $26,838 | $27,792 |
Similar Demographics by Householder Income Ages 45 - 64 years
Demographics Similar to Pakistanis by Householder Income Ages 45 - 64 years
In terms of householder income ages 45 - 64 years, the demographic groups most similar to Pakistanis are Portuguese ($105,309, a difference of 0.010%), Immigrants from Saudi Arabia ($105,249, a difference of 0.060%), Immigrants from Northern Africa ($105,430, a difference of 0.11%), Native Hawaiian ($105,149, a difference of 0.16%), and Peruvian ($105,070, a difference of 0.23%).
| Demographics | Rating | Rank | Householder Income Ages 45 - 64 years |
| Immigrants | Western Asia | 95.0 /100 | #118 | Exceptional $106,217 |
| Immigrants | Jordan | 94.9 /100 | #119 | Exceptional $106,164 |
| Immigrants | South Eastern Asia | 94.8 /100 | #120 | Exceptional $106,109 |
| Poles | 94.4 /100 | #121 | Exceptional $105,952 |
| Immigrants | North Macedonia | 94.2 /100 | #122 | Exceptional $105,892 |
| Danes | 93.4 /100 | #123 | Exceptional $105,619 |
| Immigrants | Northern Africa | 92.8 /100 | #124 | Exceptional $105,430 |
| Pakistanis | 92.4 /100 | #125 | Exceptional $105,317 |
| Portuguese | 92.4 /100 | #126 | Exceptional $105,309 |
| Immigrants | Saudi Arabia | 92.2 /100 | #127 | Exceptional $105,249 |
| Native Hawaiians | 91.8 /100 | #128 | Exceptional $105,149 |
| Peruvians | 91.5 /100 | #129 | Exceptional $105,070 |
| Immigrants | Zimbabwe | 91.2 /100 | #130 | Exceptional $104,992 |
| Immigrants | Syria | 90.7 /100 | #131 | Exceptional $104,858 |
| Lebanese | 90.1 /100 | #132 | Exceptional $104,734 |
Demographics Similar to Spanish Americans by Householder Income Ages 45 - 64 years
In terms of householder income ages 45 - 64 years, the demographic groups most similar to Spanish Americans are Immigrants from Micronesia ($87,864, a difference of 0.030%), Immigrants from Liberia ($87,739, a difference of 0.11%), Guatemalan ($87,705, a difference of 0.15%), Cape Verdean ($87,580, a difference of 0.29%), and Spanish American Indian ($87,561, a difference of 0.31%).
| Demographics | Rating | Rank | Householder Income Ages 45 - 64 years |
| Somalis | 0.3 /100 | #262 | Tragic $88,600 |
| Immigrants | Senegal | 0.3 /100 | #263 | Tragic $88,421 |
| Osage | 0.3 /100 | #264 | Tragic $88,390 |
| Jamaicans | 0.2 /100 | #265 | Tragic $88,327 |
| Immigrants | West Indies | 0.2 /100 | #266 | Tragic $88,164 |
| Hmong | 0.2 /100 | #267 | Tragic $88,115 |
| Immigrants | Micronesia | 0.2 /100 | #268 | Tragic $87,864 |
| Spanish Americans | 0.2 /100 | #269 | Tragic $87,836 |
| Immigrants | Liberia | 0.2 /100 | #270 | Tragic $87,739 |
| Guatemalans | 0.2 /100 | #271 | Tragic $87,705 |
| Cape Verdeans | 0.2 /100 | #272 | Tragic $87,580 |
| Spanish American Indians | 0.2 /100 | #273 | Tragic $87,561 |
| Iroquois | 0.1 /100 | #274 | Tragic $87,255 |
| Immigrants | Belize | 0.1 /100 | #275 | Tragic $87,229 |
| Immigrants | Latin America | 0.1 /100 | #276 | Tragic $87,219 |