Panamanian vs Ecuadorian Householder Income Ages 45 - 64 years
COMPARE
Panamanian
Ecuadorian
Householder Income Ages 45 - 64 years
Householder Income Ages 45 - 64 years Comparison
Panamanians
Ecuadorians
$96,066
HOUSEHOLDER INCOME AGES 45 - 64 YEARS
10.6/ 100
METRIC RATING
214th/ 347
METRIC RANK
$93,739
HOUSEHOLDER INCOME AGES 45 - 64 YEARS
3.6/ 100
METRIC RATING
231st/ 347
METRIC RANK
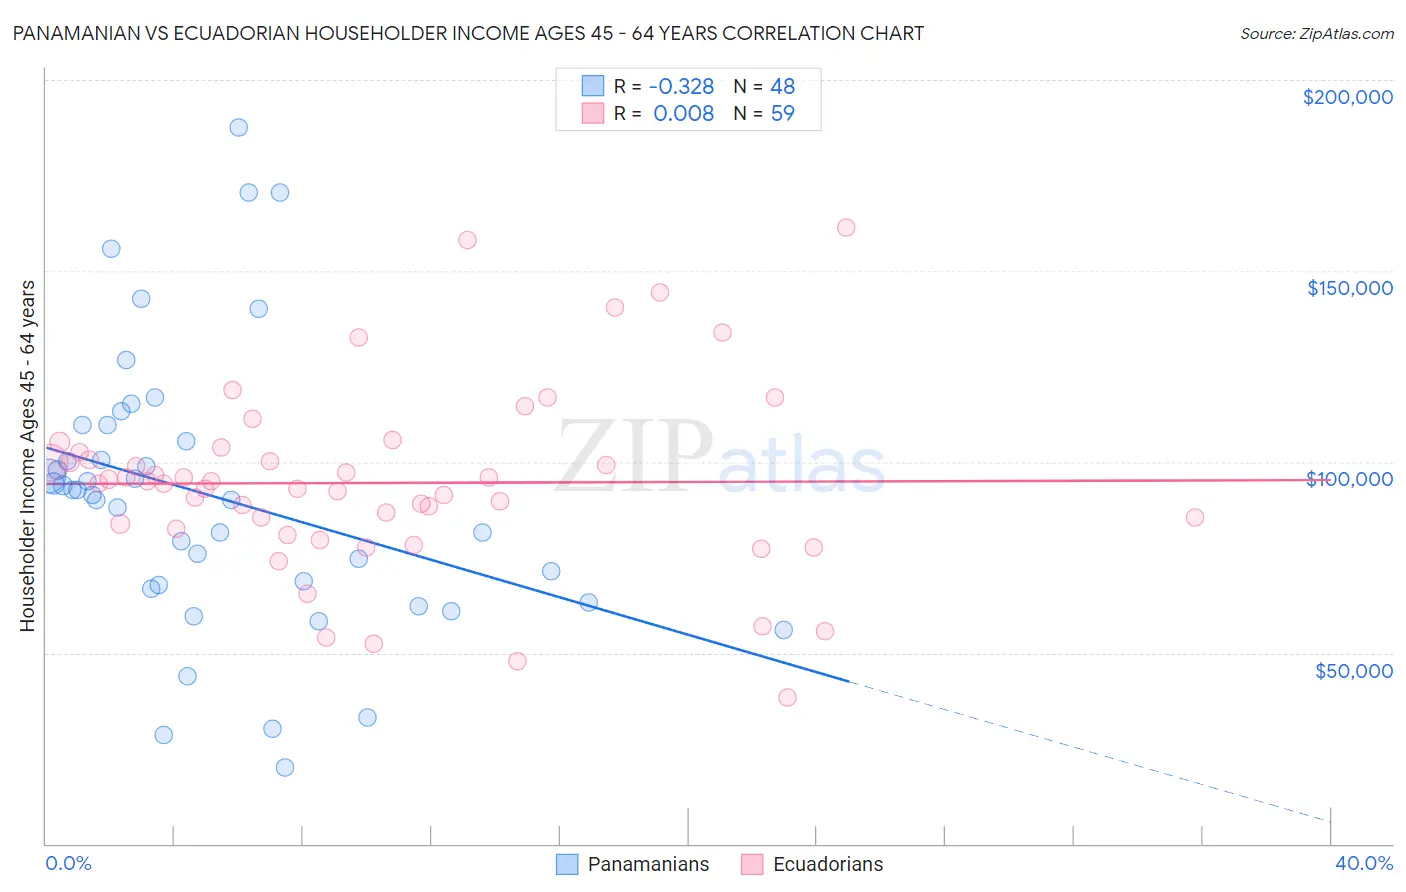
Panamanian vs Ecuadorian Householder Income Ages 45 - 64 years Correlation Chart
The statistical analysis conducted on geographies consisting of 280,831,012 people shows a mild negative correlation between the proportion of Panamanians and household income with householder between the ages 45 and 64 in the United States with a correlation coefficient (R) of -0.328 and weighted average of $96,066. Similarly, the statistical analysis conducted on geographies consisting of 317,361,637 people shows no correlation between the proportion of Ecuadorians and household income with householder between the ages 45 and 64 in the United States with a correlation coefficient (R) of 0.008 and weighted average of $93,739, a difference of 2.5%.
Householder Income Ages 45 - 64 years Correlation Summary
| Measurement | Panamanian | Ecuadorian |
| Minimum | $19,813 | $38,250 |
| Maximum | $187,621 | $161,315 |
| Range | $167,808 | $123,065 |
| Mean | $90,923 | $94,502 |
| Median | $91,973 | $94,317 |
| Interquartile 25% (IQ1) | $67,292 | $82,422 |
| Interquartile 75% (IQ3) | $107,469 | $102,541 |
| Interquartile Range (IQR) | $40,176 | $20,119 |
| Standard Deviation (Sample) | $36,458 | $24,241 |
| Standard Deviation (Population) | $36,077 | $24,034 |
Demographics Similar to Panamanians and Ecuadorians by Householder Income Ages 45 - 64 years
In terms of householder income ages 45 - 64 years, the demographic groups most similar to Panamanians are Immigrants from Uruguay ($96,086, a difference of 0.020%), Venezuelan ($96,460, a difference of 0.41%), Nigerian ($95,492, a difference of 0.60%), Immigrants from Venezuela ($95,342, a difference of 0.76%), and Immigrants from Ghana ($94,982, a difference of 1.1%). Similarly, the demographic groups most similar to Ecuadorians are Sudanese ($93,718, a difference of 0.020%), Immigrants from Sudan ($93,781, a difference of 0.040%), Vietnamese ($93,788, a difference of 0.050%), Immigrants from Panama ($93,815, a difference of 0.080%), and Alaska Native ($93,991, a difference of 0.27%).
| Demographics | Rating | Rank | Householder Income Ages 45 - 64 years |
| Venezuelans | 12.6 /100 | #212 | Poor $96,460 |
| Immigrants | Uruguay | 10.7 /100 | #213 | Poor $96,086 |
| Panamanians | 10.6 /100 | #214 | Poor $96,066 |
| Nigerians | 8.2 /100 | #215 | Tragic $95,492 |
| Immigrants | Venezuela | 7.6 /100 | #216 | Tragic $95,342 |
| Immigrants | Ghana | 6.4 /100 | #217 | Tragic $94,982 |
| Delaware | 6.2 /100 | #218 | Tragic $94,914 |
| Immigrants | Armenia | 6.1 /100 | #219 | Tragic $94,863 |
| Salvadorans | 6.0 /100 | #220 | Tragic $94,842 |
| Immigrants | Nigeria | 5.9 /100 | #221 | Tragic $94,804 |
| Malaysians | 5.2 /100 | #222 | Tragic $94,517 |
| Immigrants | Nonimmigrants | 5.0 /100 | #223 | Tragic $94,448 |
| Immigrants | Bosnia and Herzegovina | 4.6 /100 | #224 | Tragic $94,288 |
| Bermudans | 4.4 /100 | #225 | Tragic $94,197 |
| Immigrants | Azores | 4.3 /100 | #226 | Tragic $94,138 |
| Alaska Natives | 4.0 /100 | #227 | Tragic $93,991 |
| Immigrants | Panama | 3.7 /100 | #228 | Tragic $93,815 |
| Vietnamese | 3.6 /100 | #229 | Tragic $93,788 |
| Immigrants | Sudan | 3.6 /100 | #230 | Tragic $93,781 |
| Ecuadorians | 3.6 /100 | #231 | Tragic $93,739 |
| Sudanese | 3.5 /100 | #232 | Tragic $93,718 |