Panamanian vs Immigrants from Chile Median Household Income
COMPARE
Panamanian
Immigrants from Chile
Median Household Income
Median Household Income Comparison
Panamanians
Immigrants from Chile
$82,272
MEDIAN HOUSEHOLD INCOME
14.0/ 100
METRIC RATING
214th/ 347
METRIC RANK
$88,388
MEDIAN HOUSEHOLD INCOME
89.2/ 100
METRIC RATING
139th/ 347
METRIC RANK
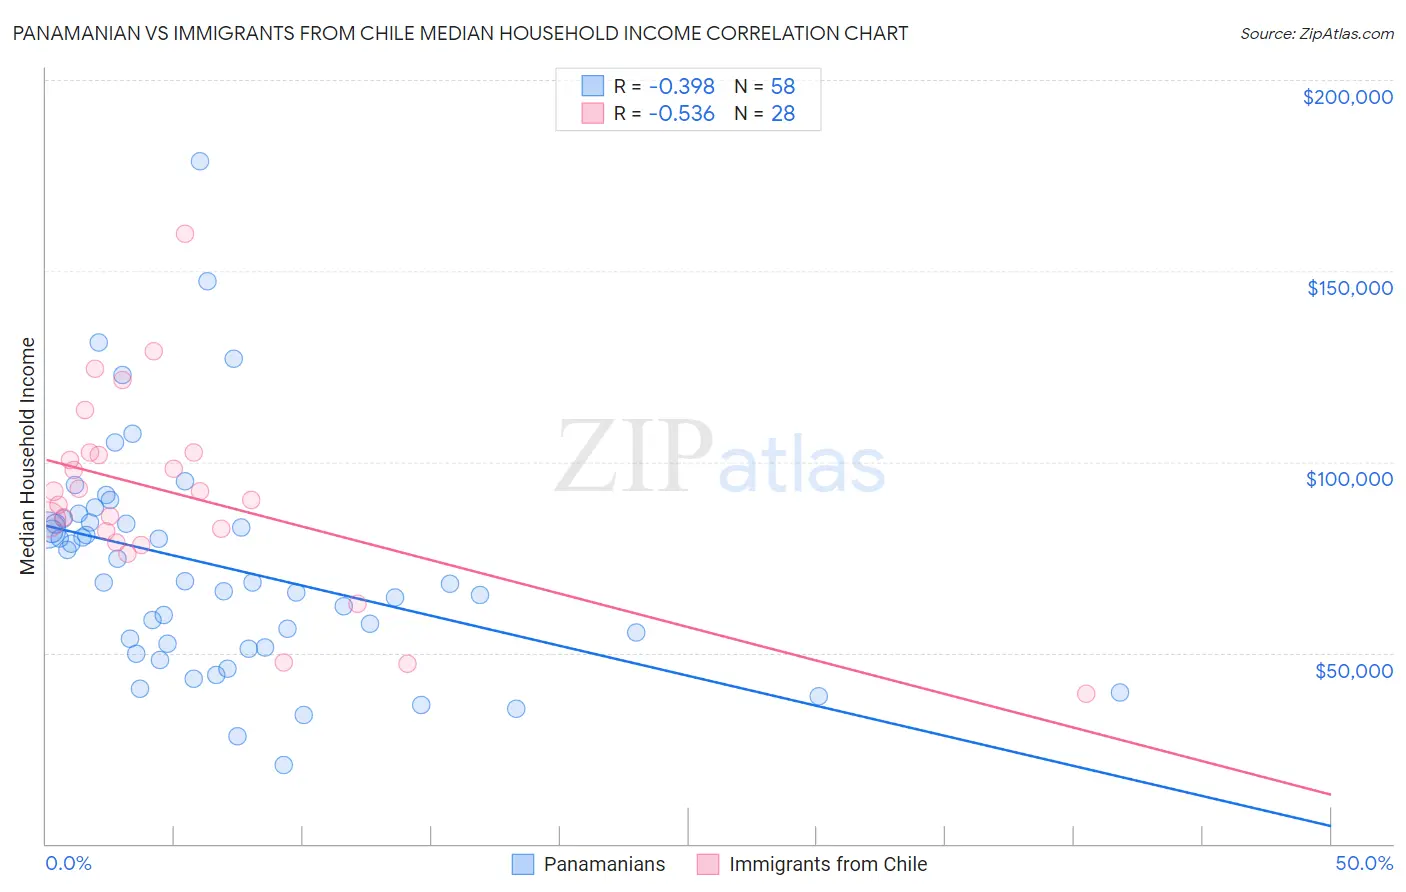
Panamanian vs Immigrants from Chile Median Household Income Correlation Chart
The statistical analysis conducted on geographies consisting of 281,034,556 people shows a mild negative correlation between the proportion of Panamanians and median household income in the United States with a correlation coefficient (R) of -0.398 and weighted average of $82,272. Similarly, the statistical analysis conducted on geographies consisting of 218,579,752 people shows a substantial negative correlation between the proportion of Immigrants from Chile and median household income in the United States with a correlation coefficient (R) of -0.536 and weighted average of $88,388, a difference of 7.4%.
Median Household Income Correlation Summary
| Measurement | Panamanian | Immigrants from Chile |
| Minimum | $20,556 | $39,375 |
| Maximum | $178,834 | $159,688 |
| Range | $158,278 | $120,313 |
| Mean | $72,362 | $91,361 |
| Median | $68,346 | $91,251 |
| Interquartile 25% (IQ1) | $51,530 | $80,247 |
| Interquartile 75% (IQ3) | $83,972 | $102,116 |
| Interquartile Range (IQR) | $32,442 | $21,868 |
| Standard Deviation (Sample) | $29,634 | $25,347 |
| Standard Deviation (Population) | $29,377 | $24,890 |
Similar Demographics by Median Household Income
Demographics Similar to Panamanians by Median Household Income
In terms of median household income, the demographic groups most similar to Panamanians are Vietnamese ($82,248, a difference of 0.030%), Yugoslavian ($82,186, a difference of 0.10%), Nepalese ($82,410, a difference of 0.17%), Venezuelan ($82,432, a difference of 0.20%), and Salvadoran ($82,449, a difference of 0.22%).
| Demographics | Rating | Rank | Median Household Income |
| Dutch | 20.3 /100 | #207 | Fair $82,971 |
| French Canadians | 18.7 /100 | #208 | Poor $82,810 |
| Immigrants | Iraq | 16.7 /100 | #209 | Poor $82,594 |
| Immigrants | Uruguay | 16.4 /100 | #210 | Poor $82,560 |
| Salvadorans | 15.4 /100 | #211 | Poor $82,449 |
| Venezuelans | 15.3 /100 | #212 | Poor $82,432 |
| Nepalese | 15.1 /100 | #213 | Poor $82,410 |
| Panamanians | 14.0 /100 | #214 | Poor $82,272 |
| Vietnamese | 13.8 /100 | #215 | Poor $82,248 |
| Yugoslavians | 13.3 /100 | #216 | Poor $82,186 |
| Ecuadorians | 12.5 /100 | #217 | Poor $82,070 |
| Whites/Caucasians | 12.2 /100 | #218 | Poor $82,029 |
| Nigerians | 10.3 /100 | #219 | Poor $81,725 |
| Immigrants | Venezuela | 9.0 /100 | #220 | Tragic $81,506 |
| Immigrants | Ghana | 9.0 /100 | #221 | Tragic $81,489 |
Demographics Similar to Immigrants from Chile by Median Household Income
In terms of median household income, the demographic groups most similar to Immigrants from Chile are Arab ($88,398, a difference of 0.010%), Sierra Leonean ($88,463, a difference of 0.080%), Polish ($88,472, a difference of 0.090%), Immigrants from Sierra Leone ($88,498, a difference of 0.12%), and Swedish ($88,524, a difference of 0.15%).
| Demographics | Rating | Rank | Median Household Income |
| Europeans | 91.2 /100 | #132 | Exceptional $88,751 |
| Immigrants | Ethiopia | 90.9 /100 | #133 | Exceptional $88,687 |
| Swedes | 90.0 /100 | #134 | Exceptional $88,524 |
| Immigrants | Sierra Leone | 89.9 /100 | #135 | Excellent $88,498 |
| Poles | 89.7 /100 | #136 | Excellent $88,472 |
| Sierra Leoneans | 89.6 /100 | #137 | Excellent $88,463 |
| Arabs | 89.2 /100 | #138 | Excellent $88,398 |
| Immigrants | Chile | 89.2 /100 | #139 | Excellent $88,388 |
| Lebanese | 87.2 /100 | #140 | Excellent $88,091 |
| Immigrants | Morocco | 86.0 /100 | #141 | Excellent $87,930 |
| Canadians | 84.7 /100 | #142 | Excellent $87,769 |
| Danes | 83.9 /100 | #143 | Excellent $87,676 |
| Serbians | 83.0 /100 | #144 | Excellent $87,572 |
| Ugandans | 82.9 /100 | #145 | Excellent $87,557 |
| Immigrants | Uganda | 82.8 /100 | #146 | Excellent $87,553 |