Pennsylvania German vs Subsaharan African Median Family Income
COMPARE
Pennsylvania German
Subsaharan African
Median Family Income
Median Family Income Comparison
Pennsylvania Germans
Sub-Saharan Africans
$91,763
MEDIAN FAMILY INCOME
0.4/ 100
METRIC RATING
260th/ 347
METRIC RANK
$93,748
MEDIAN FAMILY INCOME
1.0/ 100
METRIC RATING
244th/ 347
METRIC RANK
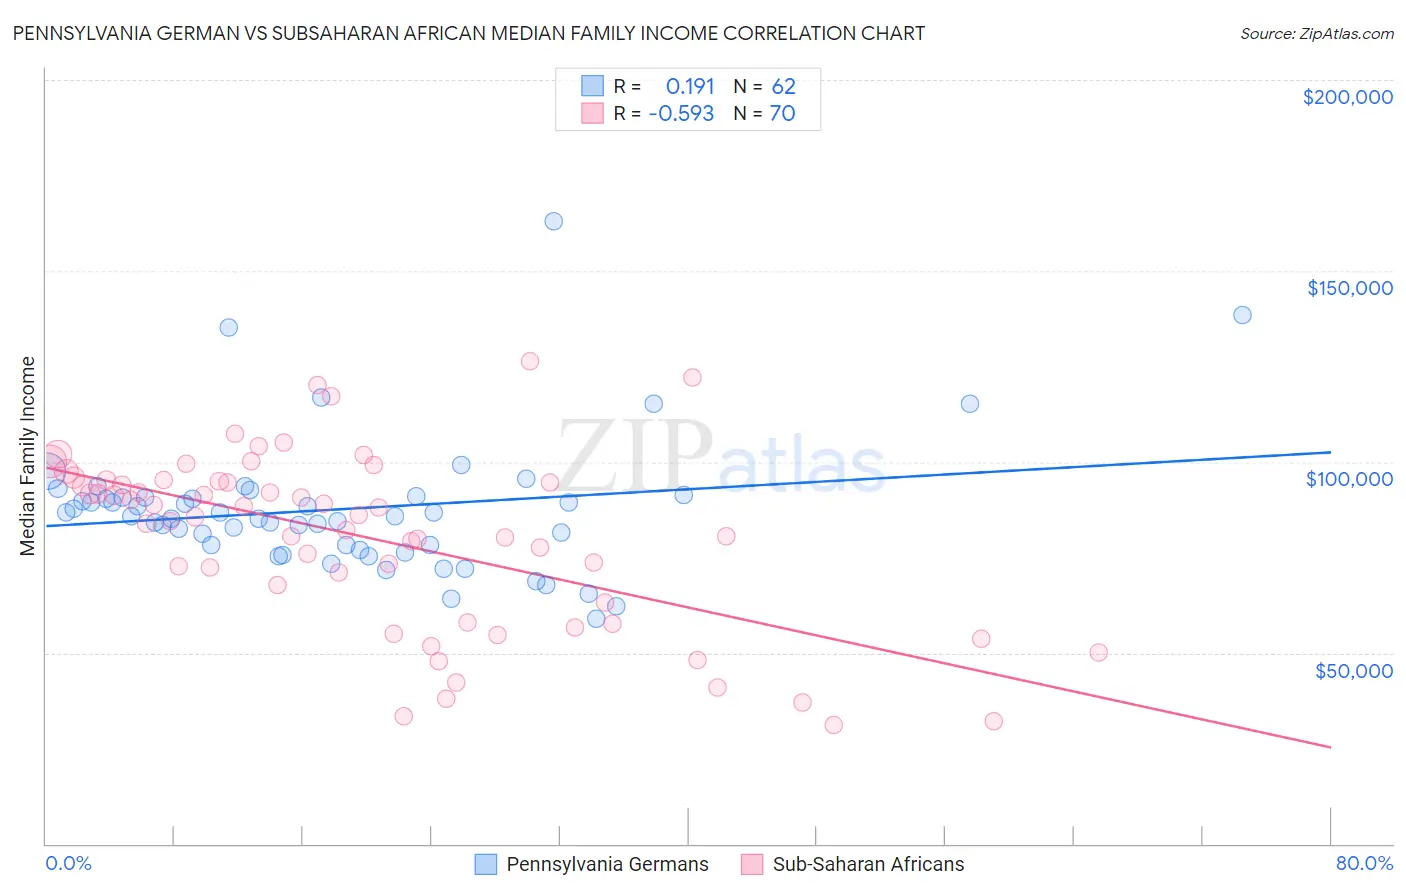
Pennsylvania German vs Subsaharan African Median Family Income Correlation Chart
The statistical analysis conducted on geographies consisting of 234,014,323 people shows a poor positive correlation between the proportion of Pennsylvania Germans and median family income in the United States with a correlation coefficient (R) of 0.191 and weighted average of $91,763. Similarly, the statistical analysis conducted on geographies consisting of 507,233,451 people shows a substantial negative correlation between the proportion of Sub-Saharan Africans and median family income in the United States with a correlation coefficient (R) of -0.593 and weighted average of $93,748, a difference of 2.2%.
Median Family Income Correlation Summary
| Measurement | Pennsylvania German | Subsaharan African |
| Minimum | $58,875 | $31,084 |
| Maximum | $162,917 | $126,507 |
| Range | $104,042 | $95,423 |
| Mean | $87,564 | $80,060 |
| Median | $85,824 | $85,890 |
| Interquartile 25% (IQ1) | $78,127 | $63,281 |
| Interquartile 75% (IQ3) | $90,788 | $94,886 |
| Interquartile Range (IQR) | $12,661 | $31,605 |
| Standard Deviation (Sample) | $17,527 | $22,942 |
| Standard Deviation (Population) | $17,385 | $22,778 |
Demographics Similar to Pennsylvania Germans and Sub-Saharan Africans by Median Family Income
In terms of median family income, the demographic groups most similar to Pennsylvania Germans are Inupiat ($91,730, a difference of 0.040%), Liberian ($91,722, a difference of 0.040%), Cape Verdean ($91,848, a difference of 0.090%), Osage ($91,926, a difference of 0.18%), and American ($92,096, a difference of 0.36%). Similarly, the demographic groups most similar to Sub-Saharan Africans are German Russian ($93,858, a difference of 0.12%), Immigrants from Middle Africa ($93,593, a difference of 0.17%), Barbadian ($93,919, a difference of 0.18%), Guyanese ($93,373, a difference of 0.40%), and Immigrants from Senegal ($92,912, a difference of 0.90%).
| Demographics | Rating | Rank | Median Family Income |
| Barbadians | 1.1 /100 | #242 | Tragic $93,919 |
| German Russians | 1.1 /100 | #243 | Tragic $93,858 |
| Sub-Saharan Africans | 1.0 /100 | #244 | Tragic $93,748 |
| Immigrants | Middle Africa | 1.0 /100 | #245 | Tragic $93,593 |
| Guyanese | 0.9 /100 | #246 | Tragic $93,373 |
| Immigrants | Senegal | 0.7 /100 | #247 | Tragic $92,912 |
| French American Indians | 0.7 /100 | #248 | Tragic $92,872 |
| Immigrants | Ecuador | 0.7 /100 | #249 | Tragic $92,837 |
| West Indians | 0.6 /100 | #250 | Tragic $92,765 |
| Immigrants | Somalia | 0.6 /100 | #251 | Tragic $92,609 |
| Immigrants | El Salvador | 0.6 /100 | #252 | Tragic $92,545 |
| Immigrants | Guyana | 0.6 /100 | #253 | Tragic $92,513 |
| Immigrants | Barbados | 0.5 /100 | #254 | Tragic $92,419 |
| Immigrants | Laos | 0.5 /100 | #255 | Tragic $92,239 |
| Nicaraguans | 0.5 /100 | #256 | Tragic $92,231 |
| Americans | 0.4 /100 | #257 | Tragic $92,096 |
| Osage | 0.4 /100 | #258 | Tragic $91,926 |
| Cape Verdeans | 0.4 /100 | #259 | Tragic $91,848 |
| Pennsylvania Germans | 0.4 /100 | #260 | Tragic $91,763 |
| Inupiat | 0.4 /100 | #261 | Tragic $91,730 |
| Liberians | 0.4 /100 | #262 | Tragic $91,722 |