Portuguese vs Lebanese Per Capita Income
COMPARE
Portuguese
Lebanese
Per Capita Income
Per Capita Income Comparison
Portuguese
Lebanese
$44,362
PER CAPITA INCOME
68.7/ 100
METRIC RATING
154th/ 347
METRIC RANK
$45,840
PER CAPITA INCOME
92.0/ 100
METRIC RATING
123rd/ 347
METRIC RANK
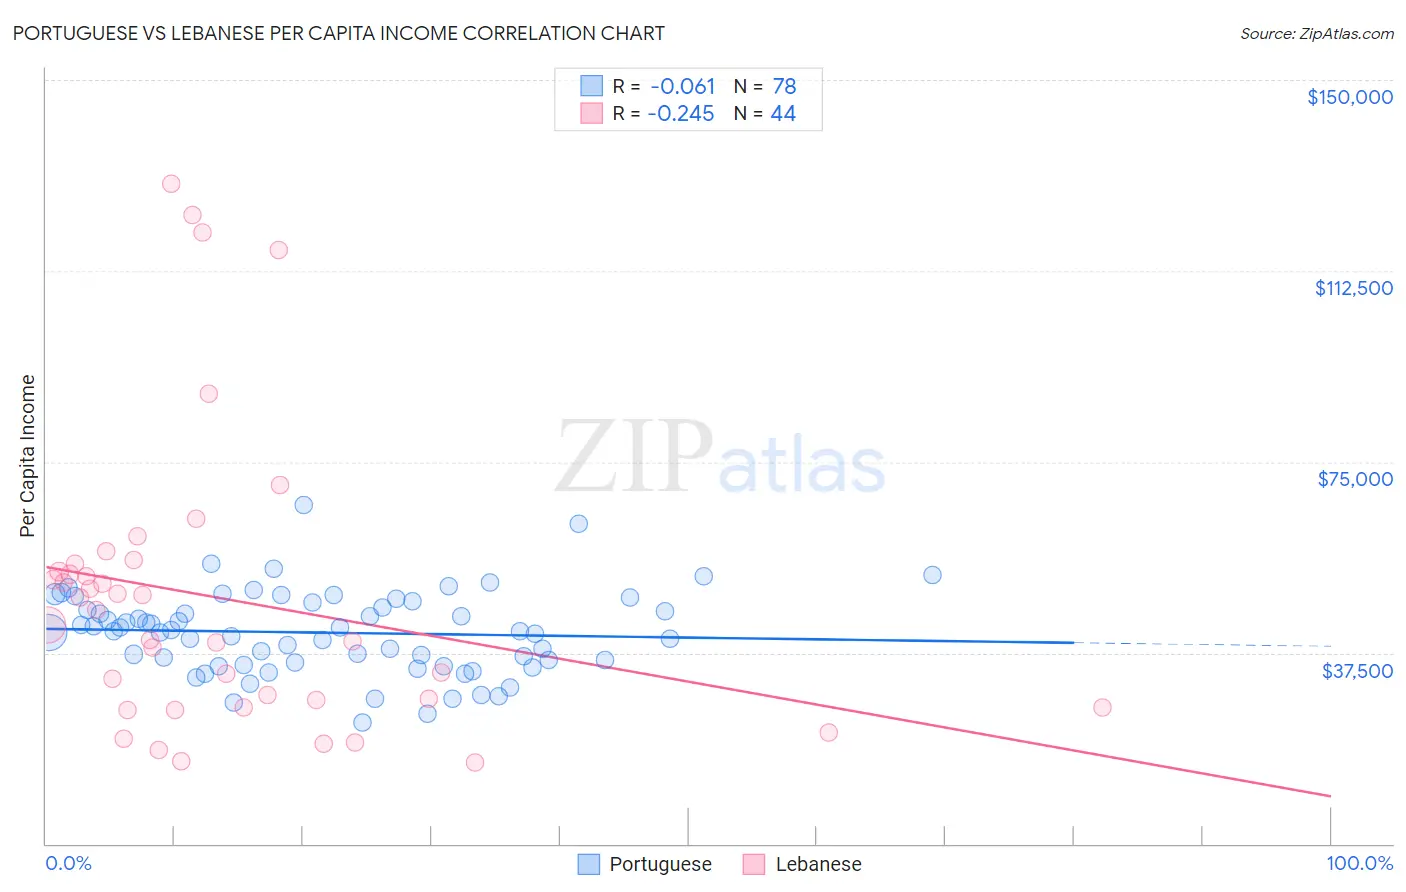
Portuguese vs Lebanese Per Capita Income Correlation Chart
The statistical analysis conducted on geographies consisting of 450,379,372 people shows a slight negative correlation between the proportion of Portuguese and per capita income in the United States with a correlation coefficient (R) of -0.061 and weighted average of $44,362. Similarly, the statistical analysis conducted on geographies consisting of 401,645,404 people shows a weak negative correlation between the proportion of Lebanese and per capita income in the United States with a correlation coefficient (R) of -0.245 and weighted average of $45,840, a difference of 3.3%.
Per Capita Income Correlation Summary
| Measurement | Portuguese | Lebanese |
| Minimum | $23,853 | $15,839 |
| Maximum | $66,467 | $129,581 |
| Range | $42,614 | $113,742 |
| Mean | $41,456 | $48,201 |
| Median | $41,782 | $44,395 |
| Interquartile 25% (IQ1) | $35,480 | $27,415 |
| Interquartile 75% (IQ3) | $47,466 | $54,286 |
| Interquartile Range (IQR) | $11,986 | $26,871 |
| Standard Deviation (Sample) | $8,108 | $28,531 |
| Standard Deviation (Population) | $8,056 | $28,205 |
Similar Demographics by Per Capita Income
Demographics Similar to Portuguese by Per Capita Income
In terms of per capita income, the demographic groups most similar to Portuguese are Uruguayan ($44,318, a difference of 0.10%), Scottish ($44,440, a difference of 0.18%), Peruvian ($44,479, a difference of 0.26%), Norwegian ($44,480, a difference of 0.27%), and Slovak ($44,229, a difference of 0.30%).
| Demographics | Rating | Rank | Per Capita Income |
| Czechs | 74.1 /100 | #147 | Good $44,595 |
| Immigrants | Armenia | 73.1 /100 | #148 | Good $44,552 |
| Koreans | 72.5 /100 | #149 | Good $44,522 |
| Immigrants | Eritrea | 72.1 /100 | #150 | Good $44,509 |
| Norwegians | 71.5 /100 | #151 | Good $44,480 |
| Peruvians | 71.5 /100 | #152 | Good $44,479 |
| Scottish | 70.6 /100 | #153 | Good $44,440 |
| Portuguese | 68.7 /100 | #154 | Good $44,362 |
| Uruguayans | 67.6 /100 | #155 | Good $44,318 |
| Slovaks | 65.4 /100 | #156 | Good $44,229 |
| South American Indians | 64.8 /100 | #157 | Good $44,206 |
| Immigrants | Nepal | 64.3 /100 | #158 | Good $44,187 |
| South Americans | 62.4 /100 | #159 | Good $44,114 |
| Danes | 61.9 /100 | #160 | Good $44,095 |
| Costa Ricans | 61.8 /100 | #161 | Good $44,090 |
Demographics Similar to Lebanese by Per Capita Income
In terms of per capita income, the demographic groups most similar to Lebanese are European ($45,836, a difference of 0.010%), Moroccan ($45,854, a difference of 0.030%), Canadian ($45,858, a difference of 0.040%), Zimbabwean ($45,804, a difference of 0.080%), and Palestinian ($45,790, a difference of 0.11%).
| Demographics | Rating | Rank | Per Capita Income |
| Poles | 94.1 /100 | #116 | Exceptional $46,123 |
| Chinese | 93.9 /100 | #117 | Exceptional $46,098 |
| Immigrants | Saudi Arabia | 93.3 /100 | #118 | Exceptional $46,008 |
| Immigrants | Poland | 93.1 /100 | #119 | Exceptional $45,979 |
| Immigrants | Ethiopia | 92.7 /100 | #120 | Exceptional $45,923 |
| Canadians | 92.2 /100 | #121 | Exceptional $45,858 |
| Moroccans | 92.1 /100 | #122 | Exceptional $45,854 |
| Lebanese | 92.0 /100 | #123 | Exceptional $45,840 |
| Europeans | 92.0 /100 | #124 | Exceptional $45,836 |
| Zimbabweans | 91.7 /100 | #125 | Exceptional $45,804 |
| Palestinians | 91.6 /100 | #126 | Exceptional $45,790 |
| Immigrants | Germany | 91.3 /100 | #127 | Exceptional $45,751 |
| Swedes | 91.3 /100 | #128 | Exceptional $45,750 |
| Luxembourgers | 90.4 /100 | #129 | Exceptional $45,663 |
| Arabs | 90.4 /100 | #130 | Exceptional $45,662 |