Pueblo vs Colville Per Capita Income
COMPARE
Pueblo
Colville
Per Capita Income
Per Capita Income Comparison
Pueblo
Colville
$32,012
PER CAPITA INCOME
0.0/ 100
METRIC RATING
339th/ 347
METRIC RANK
$38,047
PER CAPITA INCOME
0.2/ 100
METRIC RATING
279th/ 347
METRIC RANK
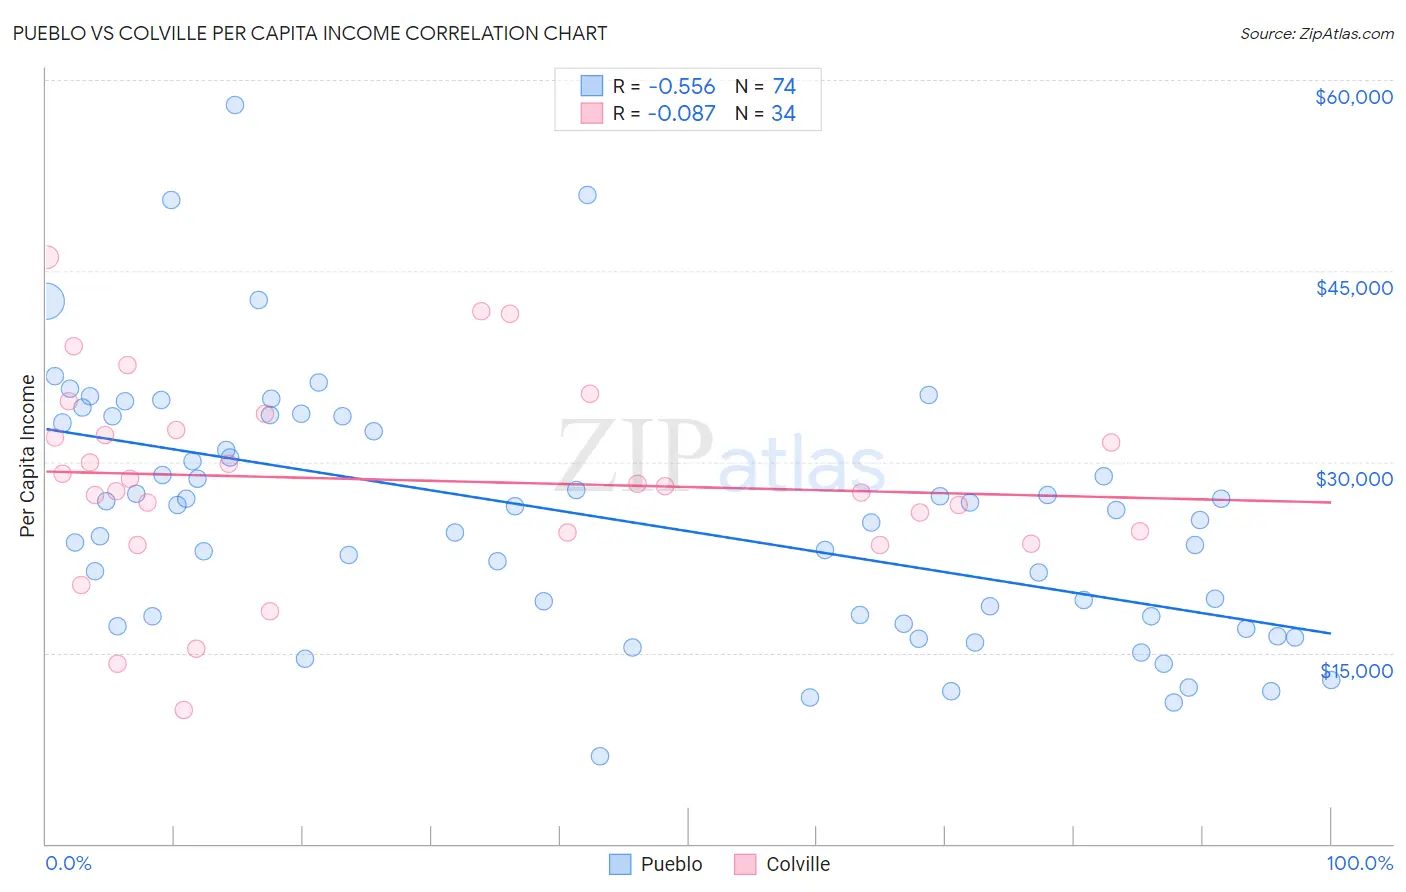
Pueblo vs Colville Per Capita Income Correlation Chart
The statistical analysis conducted on geographies consisting of 120,085,924 people shows a substantial negative correlation between the proportion of Pueblo and per capita income in the United States with a correlation coefficient (R) of -0.556 and weighted average of $32,012. Similarly, the statistical analysis conducted on geographies consisting of 34,687,707 people shows a slight negative correlation between the proportion of Colville and per capita income in the United States with a correlation coefficient (R) of -0.087 and weighted average of $38,047, a difference of 18.9%.
Per Capita Income Correlation Summary
| Measurement | Pueblo | Colville |
| Minimum | $6,914 | $10,541 |
| Maximum | $58,045 | $46,065 |
| Range | $51,131 | $35,524 |
| Mean | $25,689 | $28,594 |
| Median | $25,827 | $28,215 |
| Interquartile 25% (IQ1) | $17,826 | $24,418 |
| Interquartile 75% (IQ3) | $33,050 | $32,462 |
| Interquartile Range (IQR) | $15,224 | $8,044 |
| Standard Deviation (Sample) | $9,930 | $7,817 |
| Standard Deviation (Population) | $9,862 | $7,701 |
Similar Demographics by Per Capita Income
Demographics Similar to Pueblo by Per Capita Income
In terms of per capita income, the demographic groups most similar to Pueblo are Crow ($31,729, a difference of 0.89%), Arapaho ($32,345, a difference of 1.0%), Puerto Rican ($31,268, a difference of 2.4%), Hopi ($31,177, a difference of 2.7%), and Houma ($32,996, a difference of 3.1%).
| Demographics | Rating | Rank | Per Capita Income |
| Sioux | 0.0 /100 | #332 | Tragic $33,921 |
| Immigrants | Yemen | 0.0 /100 | #333 | Tragic $33,696 |
| Natives/Alaskans | 0.0 /100 | #334 | Tragic $33,279 |
| Yuman | 0.0 /100 | #335 | Tragic $33,236 |
| Yakama | 0.0 /100 | #336 | Tragic $33,009 |
| Houma | 0.0 /100 | #337 | Tragic $32,996 |
| Arapaho | 0.0 /100 | #338 | Tragic $32,345 |
| Pueblo | 0.0 /100 | #339 | Tragic $32,012 |
| Crow | 0.0 /100 | #340 | Tragic $31,729 |
| Puerto Ricans | 0.0 /100 | #341 | Tragic $31,268 |
| Hopi | 0.0 /100 | #342 | Tragic $31,177 |
| Pima | 0.0 /100 | #343 | Tragic $30,644 |
| Yup'ik | 0.0 /100 | #344 | Tragic $30,518 |
| Tohono O'odham | 0.0 /100 | #345 | Tragic $30,256 |
| Lumbee | 0.0 /100 | #346 | Tragic $29,845 |
Demographics Similar to Colville by Per Capita Income
In terms of per capita income, the demographic groups most similar to Colville are Potawatomi ($38,046, a difference of 0.0%), Immigrants from Nicaragua ($38,065, a difference of 0.050%), Comanche ($38,088, a difference of 0.11%), Hmong ($38,120, a difference of 0.19%), and Immigrants from Dominica ($37,952, a difference of 0.25%).
| Demographics | Rating | Rank | Per Capita Income |
| Immigrants | Cabo Verde | 0.3 /100 | #272 | Tragic $38,540 |
| Nepalese | 0.3 /100 | #273 | Tragic $38,442 |
| Immigrants | El Salvador | 0.3 /100 | #274 | Tragic $38,394 |
| Immigrants | Liberia | 0.2 /100 | #275 | Tragic $38,165 |
| Hmong | 0.2 /100 | #276 | Tragic $38,120 |
| Comanche | 0.2 /100 | #277 | Tragic $38,088 |
| Immigrants | Nicaragua | 0.2 /100 | #278 | Tragic $38,065 |
| Colville | 0.2 /100 | #279 | Tragic $38,047 |
| Potawatomi | 0.2 /100 | #280 | Tragic $38,046 |
| Immigrants | Dominica | 0.2 /100 | #281 | Tragic $37,952 |
| Immigrants | Laos | 0.1 /100 | #282 | Tragic $37,857 |
| Pennsylvania Germans | 0.1 /100 | #283 | Tragic $37,842 |
| Africans | 0.1 /100 | #284 | Tragic $37,785 |
| Guatemalans | 0.1 /100 | #285 | Tragic $37,766 |
| Central American Indians | 0.1 /100 | #286 | Tragic $37,699 |