Scandinavian vs Spanish American Wage/Income Gap
COMPARE
Scandinavian
Spanish American
Wage/Income Gap
Wage/Income Gap Comparison
Scandinavians
Spanish Americans
29.1%
WAGE/INCOME GAP
0.0/ 100
METRIC RATING
328th/ 347
METRIC RANK
24.6%
WAGE/INCOME GAP
93.8/ 100
METRIC RATING
125th/ 347
METRIC RANK
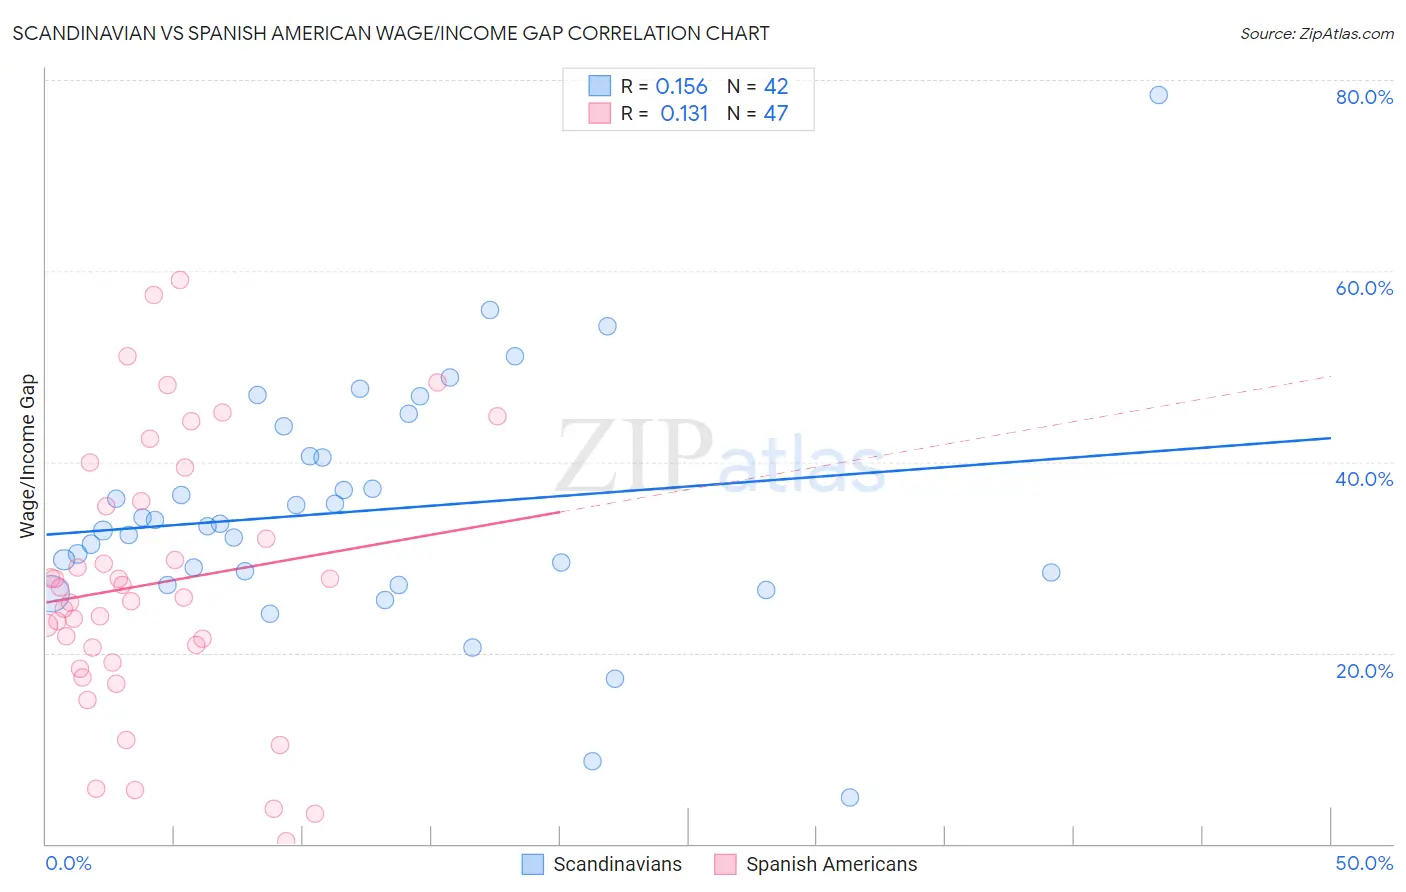
Scandinavian vs Spanish American Wage/Income Gap Correlation Chart
The statistical analysis conducted on geographies consisting of 471,744,681 people shows a poor positive correlation between the proportion of Scandinavians and wage/income gap percentage in the United States with a correlation coefficient (R) of 0.156 and weighted average of 29.1%. Similarly, the statistical analysis conducted on geographies consisting of 103,143,152 people shows a poor positive correlation between the proportion of Spanish Americans and wage/income gap percentage in the United States with a correlation coefficient (R) of 0.131 and weighted average of 24.6%, a difference of 18.1%.
Wage/Income Gap Correlation Summary
| Measurement | Scandinavian | Spanish American |
| Minimum | 4.8% | 0.29% |
| Maximum | 78.5% | 59.1% |
| Range | 73.7% | 58.8% |
| Mean | 34.9% | 27.3% |
| Median | 33.4% | 25.8% |
| Interquartile 25% (IQ1) | 28.4% | 19.0% |
| Interquartile 75% (IQ3) | 40.6% | 35.8% |
| Interquartile Range (IQR) | 12.2% | 16.8% |
| Standard Deviation (Sample) | 12.8% | 14.0% |
| Standard Deviation (Population) | 12.6% | 13.9% |
Similar Demographics by Wage/Income Gap
Demographics Similar to Scandinavians by Wage/Income Gap
In terms of wage/income gap, the demographic groups most similar to Scandinavians are Immigrants from Iran (29.1%, a difference of 0.060%), Scottish (29.1%, a difference of 0.14%), Immigrants from Belgium (29.0%, a difference of 0.17%), Hungarian (29.0%, a difference of 0.24%), and German (29.2%, a difference of 0.24%).
| Demographics | Rating | Rank | Wage/Income Gap |
| Welsh | 0.1 /100 | #321 | Tragic 28.9% |
| Immigrants | Singapore | 0.1 /100 | #322 | Tragic 28.9% |
| Norwegians | 0.1 /100 | #323 | Tragic 29.0% |
| Croatians | 0.0 /100 | #324 | Tragic 29.0% |
| Hungarians | 0.0 /100 | #325 | Tragic 29.0% |
| Immigrants | Belgium | 0.0 /100 | #326 | Tragic 29.0% |
| Immigrants | Iran | 0.0 /100 | #327 | Tragic 29.1% |
| Scandinavians | 0.0 /100 | #328 | Tragic 29.1% |
| Scottish | 0.0 /100 | #329 | Tragic 29.1% |
| Germans | 0.0 /100 | #330 | Tragic 29.2% |
| Czechs | 0.0 /100 | #331 | Tragic 29.2% |
| Immigrants | South Central Asia | 0.0 /100 | #332 | Tragic 29.3% |
| Europeans | 0.0 /100 | #333 | Tragic 29.4% |
| Swedes | 0.0 /100 | #334 | Tragic 29.4% |
| Immigrants | Taiwan | 0.0 /100 | #335 | Tragic 29.5% |
Demographics Similar to Spanish Americans by Wage/Income Gap
In terms of wage/income gap, the demographic groups most similar to Spanish Americans are Immigrants from South America (24.6%, a difference of 0.020%), Immigrants from Uruguay (24.6%, a difference of 0.020%), German Russian (24.6%, a difference of 0.020%), Immigrants from Central America (24.6%, a difference of 0.090%), and Yup'ik (24.7%, a difference of 0.14%).
| Demographics | Rating | Rank | Wage/Income Gap |
| Immigrants | Micronesia | 95.8 /100 | #118 | Exceptional 24.4% |
| Kenyans | 95.8 /100 | #119 | Exceptional 24.5% |
| Cree | 95.6 /100 | #120 | Exceptional 24.5% |
| Immigrants | Thailand | 94.9 /100 | #121 | Exceptional 24.5% |
| Apache | 94.8 /100 | #122 | Exceptional 24.5% |
| Natives/Alaskans | 94.6 /100 | #123 | Exceptional 24.6% |
| Immigrants | South America | 93.9 /100 | #124 | Exceptional 24.6% |
| Spanish Americans | 93.8 /100 | #125 | Exceptional 24.6% |
| Immigrants | Uruguay | 93.8 /100 | #126 | Exceptional 24.6% |
| German Russians | 93.7 /100 | #127 | Exceptional 24.6% |
| Immigrants | Central America | 93.5 /100 | #128 | Exceptional 24.6% |
| Yup'ik | 93.3 /100 | #129 | Exceptional 24.7% |
| Alsatians | 93.2 /100 | #130 | Exceptional 24.7% |
| Immigrants | Philippines | 93.0 /100 | #131 | Exceptional 24.7% |
| Immigrants | Costa Rica | 92.4 /100 | #132 | Exceptional 24.7% |