Scotch-Irish vs Immigrants from Africa Median Earnings
COMPARE
Scotch-Irish
Immigrants from Africa
Median Earnings
Median Earnings Comparison
Scotch-Irish
Immigrants from Africa
$44,924
MEDIAN EARNINGS
10.7/ 100
METRIC RATING
229th/ 347
METRIC RANK
$46,564
MEDIAN EARNINGS
54.6/ 100
METRIC RATING
168th/ 347
METRIC RANK
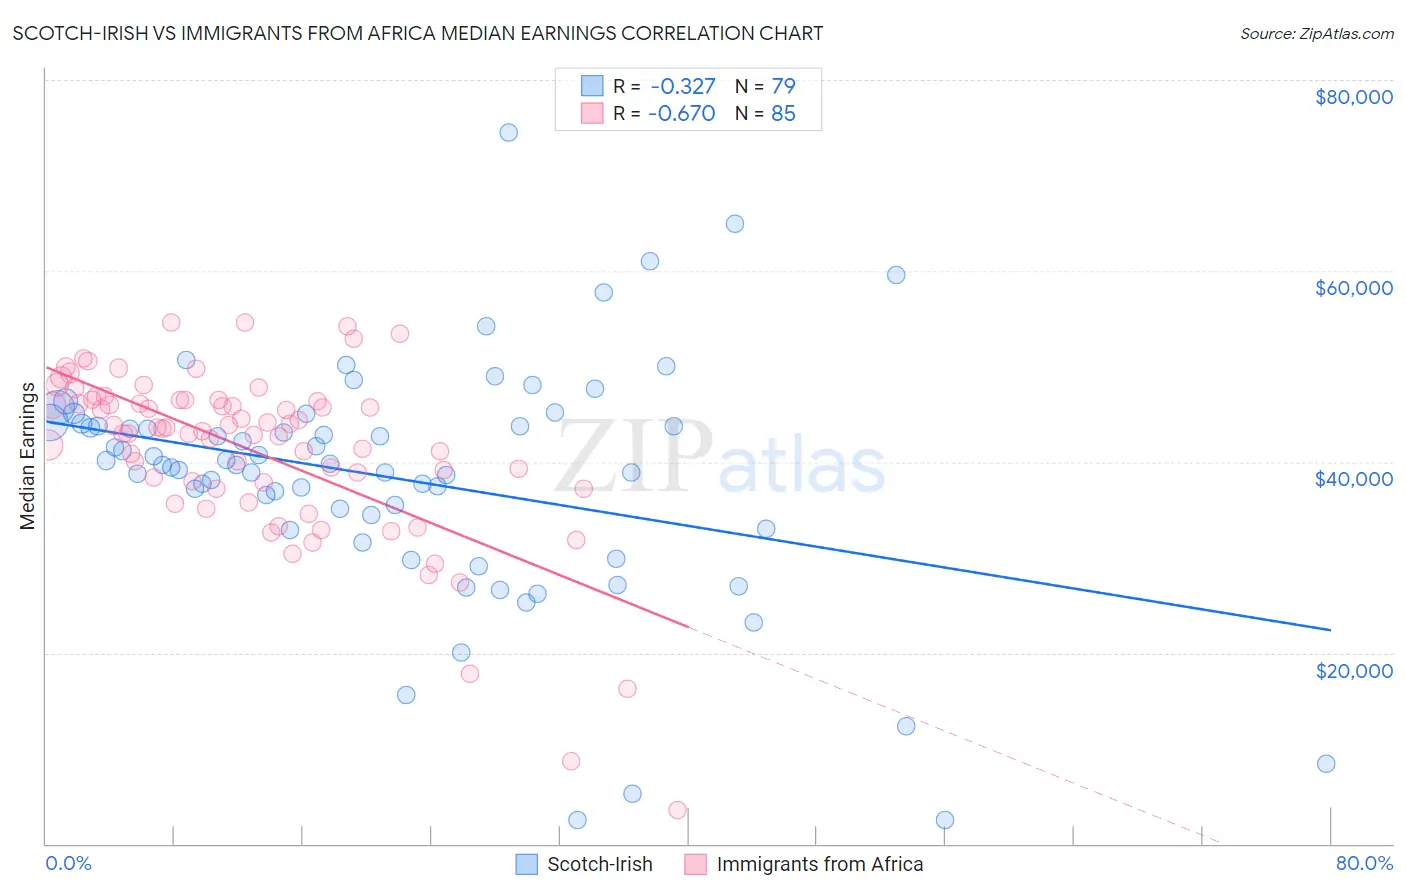
Scotch-Irish vs Immigrants from Africa Median Earnings Correlation Chart
The statistical analysis conducted on geographies consisting of 548,498,961 people shows a mild negative correlation between the proportion of Scotch-Irish and median earnings in the United States with a correlation coefficient (R) of -0.327 and weighted average of $44,924. Similarly, the statistical analysis conducted on geographies consisting of 469,401,841 people shows a significant negative correlation between the proportion of Immigrants from Africa and median earnings in the United States with a correlation coefficient (R) of -0.670 and weighted average of $46,564, a difference of 3.6%.
Median Earnings Correlation Summary
| Measurement | Scotch-Irish | Immigrants from Africa |
| Minimum | $2,499 | $3,500 |
| Maximum | $74,508 | $54,639 |
| Range | $72,009 | $51,139 |
| Mean | $38,268 | $41,149 |
| Median | $39,708 | $43,417 |
| Interquartile 25% (IQ1) | $32,986 | $37,567 |
| Interquartile 75% (IQ3) | $43,991 | $46,460 |
| Interquartile Range (IQR) | $11,005 | $8,893 |
| Standard Deviation (Sample) | $12,720 | $9,174 |
| Standard Deviation (Population) | $12,639 | $9,120 |
Similar Demographics by Median Earnings
Demographics Similar to Scotch-Irish by Median Earnings
In terms of median earnings, the demographic groups most similar to Scotch-Irish are Immigrants from Western Africa ($44,893, a difference of 0.070%), Immigrants from Iraq ($44,988, a difference of 0.14%), Japanese ($44,825, a difference of 0.22%), Native Hawaiian ($45,027, a difference of 0.23%), and Immigrants from Nigeria ($45,030, a difference of 0.24%).
| Demographics | Rating | Rank | Median Earnings |
| Immigrants | Panama | 15.0 /100 | #222 | Poor $45,198 |
| Whites/Caucasians | 15.0 /100 | #223 | Poor $45,197 |
| West Indians | 13.9 /100 | #224 | Poor $45,132 |
| Immigrants | Cambodia | 13.2 /100 | #225 | Poor $45,090 |
| Immigrants | Nigeria | 12.2 /100 | #226 | Poor $45,030 |
| Native Hawaiians | 12.2 /100 | #227 | Poor $45,027 |
| Immigrants | Iraq | 11.6 /100 | #228 | Poor $44,988 |
| Scotch-Irish | 10.7 /100 | #229 | Poor $44,924 |
| Immigrants | Western Africa | 10.3 /100 | #230 | Poor $44,893 |
| Japanese | 9.5 /100 | #231 | Tragic $44,825 |
| Delaware | 9.0 /100 | #232 | Tragic $44,783 |
| Immigrants | Sudan | 8.8 /100 | #233 | Tragic $44,767 |
| Cape Verdeans | 7.5 /100 | #234 | Tragic $44,640 |
| Venezuelans | 6.9 /100 | #235 | Tragic $44,580 |
| British West Indians | 6.7 /100 | #236 | Tragic $44,552 |
Demographics Similar to Immigrants from Africa by Median Earnings
In terms of median earnings, the demographic groups most similar to Immigrants from Africa are Immigrants from South America ($46,548, a difference of 0.030%), Costa Rican ($46,645, a difference of 0.17%), Immigrants ($46,478, a difference of 0.18%), Czechoslovakian ($46,658, a difference of 0.20%), and Scottish ($46,463, a difference of 0.22%).
| Demographics | Rating | Rank | Median Earnings |
| Immigrants | Eastern Africa | 68.0 /100 | #161 | Good $46,969 |
| South American Indians | 67.4 /100 | #162 | Good $46,952 |
| Icelanders | 66.3 /100 | #163 | Good $46,916 |
| Norwegians | 64.7 /100 | #164 | Good $46,865 |
| South Americans | 62.7 /100 | #165 | Good $46,804 |
| Czechoslovakians | 57.8 /100 | #166 | Average $46,658 |
| Costa Ricans | 57.4 /100 | #167 | Average $46,645 |
| Immigrants | Africa | 54.6 /100 | #168 | Average $46,564 |
| Immigrants | South America | 54.0 /100 | #169 | Average $46,548 |
| Immigrants | Immigrants | 51.6 /100 | #170 | Average $46,478 |
| Scottish | 51.1 /100 | #171 | Average $46,463 |
| Kenyans | 51.0 /100 | #172 | Average $46,462 |
| Ghanaians | 50.3 /100 | #173 | Average $46,440 |
| Scandinavians | 50.0 /100 | #174 | Average $46,433 |
| Basques | 48.8 /100 | #175 | Average $46,399 |