Scotch-Irish vs Immigrants from Middle Africa Median Male Earnings
COMPARE
Scotch-Irish
Immigrants from Middle Africa
Median Male Earnings
Median Male Earnings Comparison
Scotch-Irish
Immigrants from Middle Africa
$53,658
MEDIAN MALE EARNINGS
30.6/ 100
METRIC RATING
192nd/ 347
METRIC RANK
$49,201
MEDIAN MALE EARNINGS
0.6/ 100
METRIC RATING
264th/ 347
METRIC RANK
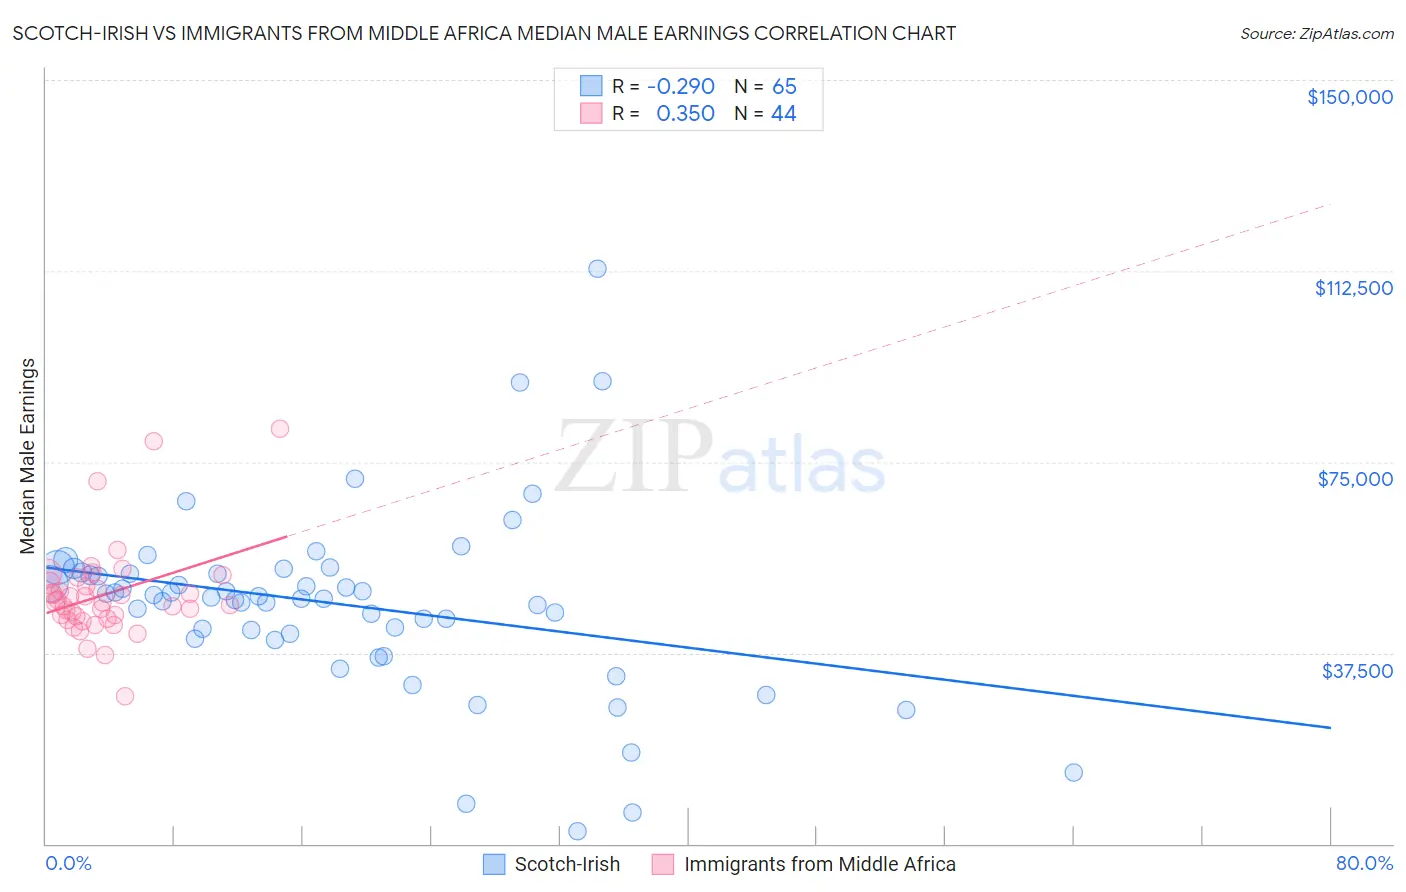
Scotch-Irish vs Immigrants from Middle Africa Median Male Earnings Correlation Chart
The statistical analysis conducted on geographies consisting of 547,724,250 people shows a weak negative correlation between the proportion of Scotch-Irish and median male earnings in the United States with a correlation coefficient (R) of -0.290 and weighted average of $53,658. Similarly, the statistical analysis conducted on geographies consisting of 202,728,043 people shows a mild positive correlation between the proportion of Immigrants from Middle Africa and median male earnings in the United States with a correlation coefficient (R) of 0.350 and weighted average of $49,201, a difference of 9.1%.
Median Male Earnings Correlation Summary
| Measurement | Scotch-Irish | Immigrants from Middle Africa |
| Minimum | $2,499 | $28,882 |
| Maximum | $113,000 | $81,458 |
| Range | $110,501 | $52,576 |
| Mean | $47,040 | $48,940 |
| Median | $48,432 | $47,419 |
| Interquartile 25% (IQ1) | $40,813 | $44,462 |
| Interquartile 75% (IQ3) | $53,223 | $50,890 |
| Interquartile Range (IQR) | $12,411 | $6,428 |
| Standard Deviation (Sample) | $17,914 | $9,309 |
| Standard Deviation (Population) | $17,776 | $9,202 |
Similar Demographics by Median Male Earnings
Demographics Similar to Scotch-Irish by Median Male Earnings
In terms of median male earnings, the demographic groups most similar to Scotch-Irish are Guamanian/Chamorro ($53,661, a difference of 0.010%), Kenyan ($53,647, a difference of 0.020%), Uruguayan ($53,680, a difference of 0.040%), Puget Sound Salish ($53,704, a difference of 0.090%), and Immigrants from Eastern Africa ($53,713, a difference of 0.10%).
| Demographics | Rating | Rank | Median Male Earnings |
| Immigrants | Sierra Leone | 36.0 /100 | #185 | Fair $53,905 |
| Colombians | 34.4 /100 | #186 | Fair $53,832 |
| Immigrants | Eritrea | 31.8 /100 | #187 | Fair $53,715 |
| Immigrants | Eastern Africa | 31.8 /100 | #188 | Fair $53,713 |
| Puget Sound Salish | 31.6 /100 | #189 | Fair $53,704 |
| Uruguayans | 31.1 /100 | #190 | Fair $53,680 |
| Guamanians/Chamorros | 30.7 /100 | #191 | Fair $53,661 |
| Scotch-Irish | 30.6 /100 | #192 | Fair $53,658 |
| Kenyans | 30.4 /100 | #193 | Fair $53,647 |
| Spanish | 29.0 /100 | #194 | Fair $53,576 |
| Immigrants | Azores | 27.5 /100 | #195 | Fair $53,503 |
| Immigrants | Africa | 26.6 /100 | #196 | Fair $53,457 |
| Immigrants | Kenya | 26.0 /100 | #197 | Fair $53,427 |
| Immigrants | Costa Rica | 22.6 /100 | #198 | Fair $53,237 |
| Tongans | 22.3 /100 | #199 | Fair $53,218 |
Demographics Similar to Immigrants from Middle Africa by Median Male Earnings
In terms of median male earnings, the demographic groups most similar to Immigrants from Middle Africa are Immigrants from Laos ($49,190, a difference of 0.020%), Nicaraguan ($49,215, a difference of 0.030%), Immigrants from West Indies ($49,271, a difference of 0.14%), Liberian ($49,318, a difference of 0.24%), and Iroquois ($49,374, a difference of 0.35%).
| Demographics | Rating | Rank | Median Male Earnings |
| British West Indians | 0.8 /100 | #257 | Tragic $49,636 |
| Cree | 0.7 /100 | #258 | Tragic $49,497 |
| Nepalese | 0.7 /100 | #259 | Tragic $49,458 |
| Iroquois | 0.7 /100 | #260 | Tragic $49,374 |
| Liberians | 0.6 /100 | #261 | Tragic $49,318 |
| Immigrants | West Indies | 0.6 /100 | #262 | Tragic $49,271 |
| Nicaraguans | 0.6 /100 | #263 | Tragic $49,215 |
| Immigrants | Middle Africa | 0.6 /100 | #264 | Tragic $49,201 |
| Immigrants | Laos | 0.6 /100 | #265 | Tragic $49,190 |
| Somalis | 0.5 /100 | #266 | Tragic $49,025 |
| Spanish Americans | 0.5 /100 | #267 | Tragic $49,008 |
| Ute | 0.4 /100 | #268 | Tragic $48,899 |
| Tsimshian | 0.4 /100 | #269 | Tragic $48,836 |
| Potawatomi | 0.4 /100 | #270 | Tragic $48,768 |
| Cherokee | 0.3 /100 | #271 | Tragic $48,669 |