Seminole vs Peruvian Median Earnings
COMPARE
Seminole
Peruvian
Median Earnings
Median Earnings Comparison
Seminole
Peruvians
$40,233
MEDIAN EARNINGS
0.0/ 100
METRIC RATING
315th/ 347
METRIC RANK
$47,628
MEDIAN EARNINGS
84.2/ 100
METRIC RATING
150th/ 347
METRIC RANK
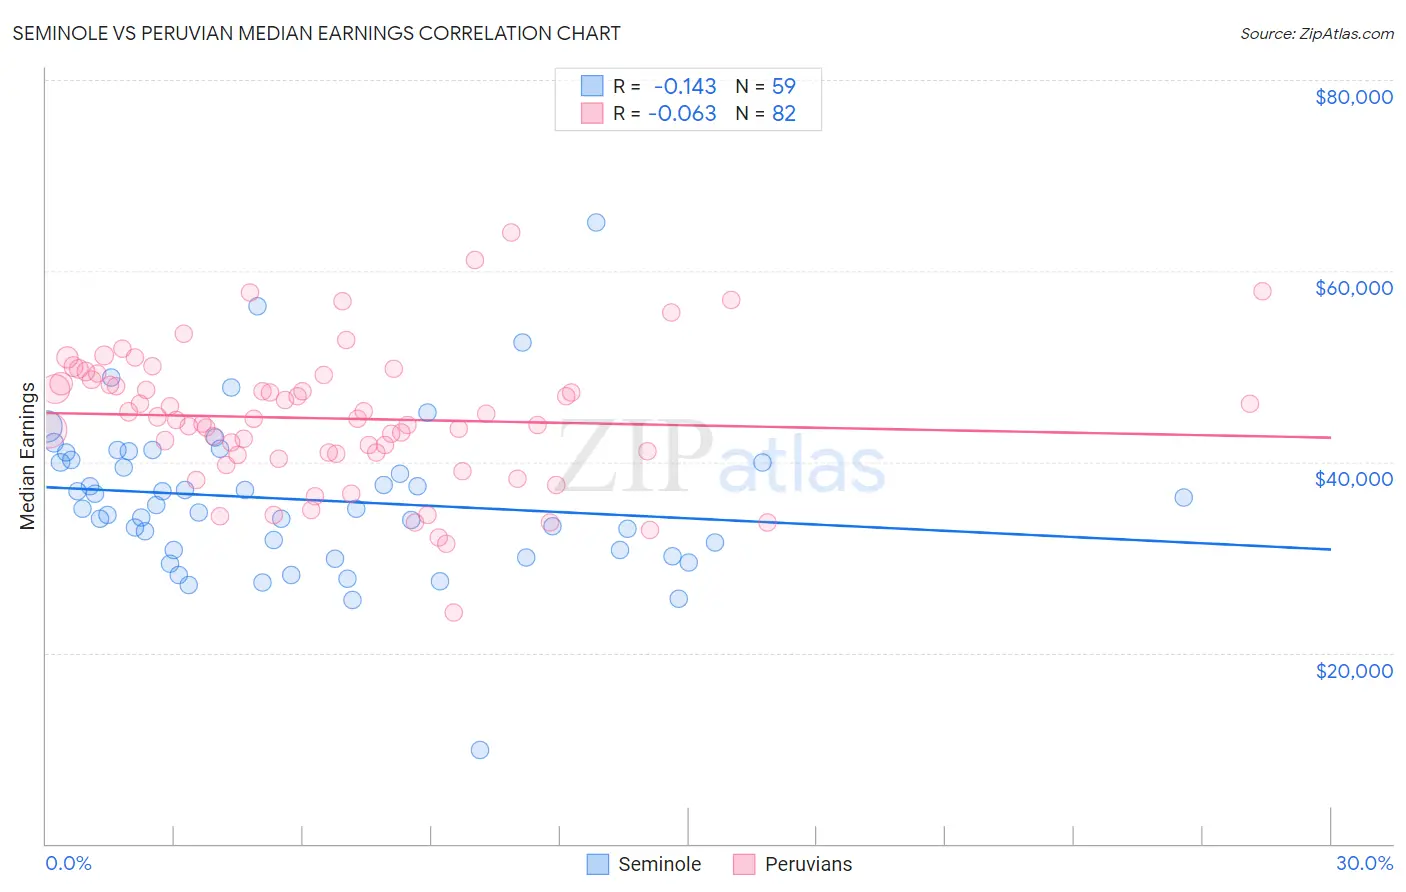
Seminole vs Peruvian Median Earnings Correlation Chart
The statistical analysis conducted on geographies consisting of 118,310,048 people shows a poor negative correlation between the proportion of Seminole and median earnings in the United States with a correlation coefficient (R) of -0.143 and weighted average of $40,233. Similarly, the statistical analysis conducted on geographies consisting of 363,247,580 people shows a slight negative correlation between the proportion of Peruvians and median earnings in the United States with a correlation coefficient (R) of -0.063 and weighted average of $47,628, a difference of 18.4%.
Median Earnings Correlation Summary
| Measurement | Seminole | Peruvian |
| Minimum | $9,817 | $24,212 |
| Maximum | $65,023 | $64,091 |
| Range | $55,206 | $39,879 |
| Mean | $36,018 | $44,547 |
| Median | $35,101 | $44,525 |
| Interquartile 25% (IQ1) | $30,747 | $40,828 |
| Interquartile 75% (IQ3) | $40,152 | $48,604 |
| Interquartile Range (IQR) | $9,405 | $7,775 |
| Standard Deviation (Sample) | $8,228 | $7,153 |
| Standard Deviation (Population) | $8,158 | $7,110 |
Similar Demographics by Median Earnings
Demographics Similar to Seminole by Median Earnings
In terms of median earnings, the demographic groups most similar to Seminole are Cheyenne ($40,233, a difference of 0.0%), Choctaw ($40,270, a difference of 0.090%), Immigrants from Honduras ($40,195, a difference of 0.090%), Fijian ($40,193, a difference of 0.10%), and Chippewa ($40,287, a difference of 0.13%).
| Demographics | Rating | Rank | Median Earnings |
| Cubans | 0.0 /100 | #308 | Tragic $40,619 |
| Immigrants | Haiti | 0.0 /100 | #309 | Tragic $40,550 |
| Apache | 0.0 /100 | #310 | Tragic $40,388 |
| Hispanics or Latinos | 0.0 /100 | #311 | Tragic $40,288 |
| Chippewa | 0.0 /100 | #312 | Tragic $40,287 |
| Choctaw | 0.0 /100 | #313 | Tragic $40,270 |
| Cheyenne | 0.0 /100 | #314 | Tragic $40,233 |
| Seminole | 0.0 /100 | #315 | Tragic $40,233 |
| Immigrants | Honduras | 0.0 /100 | #316 | Tragic $40,195 |
| Fijians | 0.0 /100 | #317 | Tragic $40,193 |
| Dutch West Indians | 0.0 /100 | #318 | Tragic $40,107 |
| Blacks/African Americans | 0.0 /100 | #319 | Tragic $40,085 |
| Immigrants | Bahamas | 0.0 /100 | #320 | Tragic $39,861 |
| Mexicans | 0.0 /100 | #321 | Tragic $39,834 |
| Immigrants | Central America | 0.0 /100 | #322 | Tragic $39,762 |
Demographics Similar to Peruvians by Median Earnings
In terms of median earnings, the demographic groups most similar to Peruvians are Luxembourger ($47,640, a difference of 0.020%), Immigrants from Oceania ($47,617, a difference of 0.020%), Immigrants from Eritrea ($47,657, a difference of 0.060%), Immigrants from South Eastern Asia ($47,671, a difference of 0.090%), and Immigrants from Germany ($47,566, a difference of 0.13%).
| Demographics | Rating | Rank | Median Earnings |
| Swedes | 88.0 /100 | #143 | Excellent $47,851 |
| Hungarians | 87.1 /100 | #144 | Excellent $47,795 |
| Immigrants | Saudi Arabia | 85.6 /100 | #145 | Excellent $47,704 |
| Immigrants | Chile | 85.5 /100 | #146 | Excellent $47,697 |
| Immigrants | South Eastern Asia | 85.0 /100 | #147 | Excellent $47,671 |
| Immigrants | Eritrea | 84.8 /100 | #148 | Excellent $47,657 |
| Luxembourgers | 84.5 /100 | #149 | Excellent $47,640 |
| Peruvians | 84.2 /100 | #150 | Excellent $47,628 |
| Immigrants | Oceania | 84.1 /100 | #151 | Excellent $47,617 |
| Immigrants | Germany | 83.1 /100 | #152 | Excellent $47,566 |
| Slavs | 81.1 /100 | #153 | Excellent $47,470 |
| Immigrants | Portugal | 77.3 /100 | #154 | Good $47,304 |
| Immigrants | Vietnam | 76.7 /100 | #155 | Good $47,282 |
| Irish | 76.6 /100 | #156 | Good $47,276 |
| Czechs | 75.1 /100 | #157 | Good $47,221 |