Seminole vs Ukrainian Householder Income Ages 45 - 64 years
COMPARE
Seminole
Ukrainian
Householder Income Ages 45 - 64 years
Householder Income Ages 45 - 64 years Comparison
Seminole
Ukrainians
$80,077
HOUSEHOLDER INCOME AGES 45 - 64 YEARS
0.0/ 100
METRIC RATING
327th/ 347
METRIC RANK
$108,475
HOUSEHOLDER INCOME AGES 45 - 64 YEARS
98.3/ 100
METRIC RATING
89th/ 347
METRIC RANK
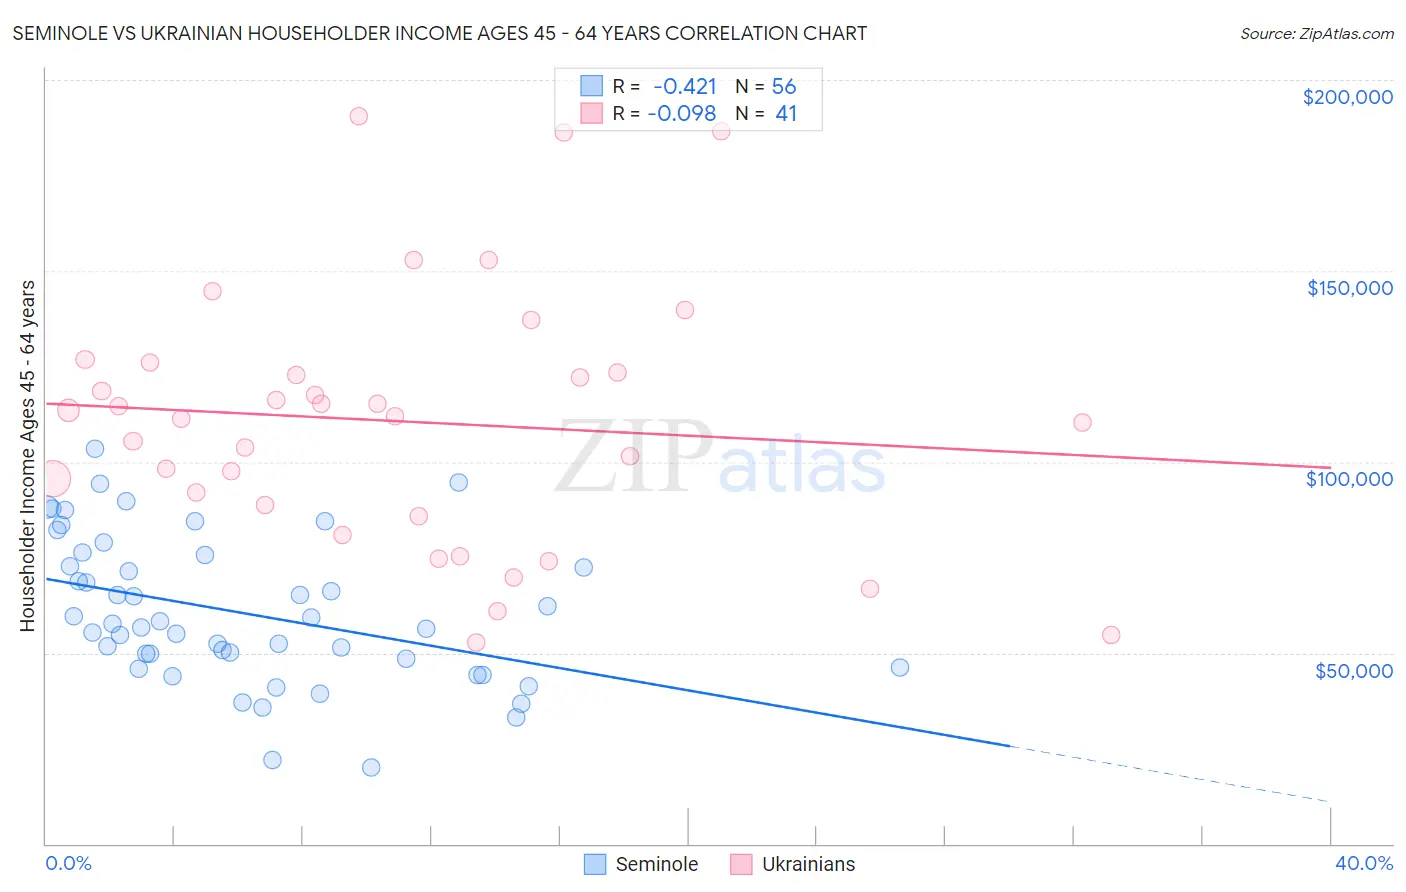
Seminole vs Ukrainian Householder Income Ages 45 - 64 years Correlation Chart
The statistical analysis conducted on geographies consisting of 118,234,136 people shows a moderate negative correlation between the proportion of Seminole and household income with householder between the ages 45 and 64 in the United States with a correlation coefficient (R) of -0.421 and weighted average of $80,077. Similarly, the statistical analysis conducted on geographies consisting of 447,644,777 people shows a slight negative correlation between the proportion of Ukrainians and household income with householder between the ages 45 and 64 in the United States with a correlation coefficient (R) of -0.098 and weighted average of $108,475, a difference of 35.5%.
Householder Income Ages 45 - 64 years Correlation Summary
| Measurement | Seminole | Ukrainian |
| Minimum | $20,000 | $52,773 |
| Maximum | $103,357 | $190,426 |
| Range | $83,357 | $137,653 |
| Mean | $60,470 | $110,581 |
| Median | $57,012 | $112,021 |
| Interquartile 25% (IQ1) | $47,308 | $87,227 |
| Interquartile 75% (IQ3) | $74,206 | $124,770 |
| Interquartile Range (IQR) | $26,898 | $37,542 |
| Standard Deviation (Sample) | $19,035 | $33,465 |
| Standard Deviation (Population) | $18,864 | $33,054 |
Similar Demographics by Householder Income Ages 45 - 64 years
Demographics Similar to Seminole by Householder Income Ages 45 - 64 years
In terms of householder income ages 45 - 64 years, the demographic groups most similar to Seminole are Native/Alaskan ($79,816, a difference of 0.33%), Dominican ($80,623, a difference of 0.68%), Immigrants from Cuba ($80,662, a difference of 0.73%), Yup'ik ($81,000, a difference of 1.1%), and Dutch West Indian ($79,171, a difference of 1.1%).
| Demographics | Rating | Rank | Householder Income Ages 45 - 64 years |
| Apache | 0.0 /100 | #320 | Tragic $82,184 |
| Yuman | 0.0 /100 | #321 | Tragic $82,139 |
| Sioux | 0.0 /100 | #322 | Tragic $81,750 |
| Bahamians | 0.0 /100 | #323 | Tragic $81,369 |
| Yup'ik | 0.0 /100 | #324 | Tragic $81,000 |
| Immigrants | Cuba | 0.0 /100 | #325 | Tragic $80,662 |
| Dominicans | 0.0 /100 | #326 | Tragic $80,623 |
| Seminole | 0.0 /100 | #327 | Tragic $80,077 |
| Natives/Alaskans | 0.0 /100 | #328 | Tragic $79,816 |
| Dutch West Indians | 0.0 /100 | #329 | Tragic $79,171 |
| Creek | 0.0 /100 | #330 | Tragic $78,960 |
| Immigrants | Dominican Republic | 0.0 /100 | #331 | Tragic $78,836 |
| Blacks/African Americans | 0.0 /100 | #332 | Tragic $78,556 |
| Immigrants | Congo | 0.0 /100 | #333 | Tragic $77,850 |
| Menominee | 0.0 /100 | #334 | Tragic $76,903 |
Demographics Similar to Ukrainians by Householder Income Ages 45 - 64 years
In terms of householder income ages 45 - 64 years, the demographic groups most similar to Ukrainians are Immigrants from Philippines ($108,471, a difference of 0.0%), Immigrants from Lebanon ($108,471, a difference of 0.0%), Croatian ($108,383, a difference of 0.080%), Romanian ($108,609, a difference of 0.12%), and Tongan ($108,643, a difference of 0.16%).
| Demographics | Rating | Rank | Householder Income Ages 45 - 64 years |
| Immigrants | North America | 98.8 /100 | #82 | Exceptional $109,198 |
| Immigrants | Spain | 98.8 /100 | #83 | Exceptional $109,051 |
| Immigrants | Western Europe | 98.6 /100 | #84 | Exceptional $108,824 |
| Immigrants | Afghanistan | 98.6 /100 | #85 | Exceptional $108,785 |
| Austrians | 98.5 /100 | #86 | Exceptional $108,692 |
| Tongans | 98.5 /100 | #87 | Exceptional $108,643 |
| Romanians | 98.5 /100 | #88 | Exceptional $108,609 |
| Ukrainians | 98.3 /100 | #89 | Exceptional $108,475 |
| Immigrants | Philippines | 98.3 /100 | #90 | Exceptional $108,471 |
| Immigrants | Lebanon | 98.3 /100 | #91 | Exceptional $108,471 |
| Croatians | 98.3 /100 | #92 | Exceptional $108,383 |
| Immigrants | Croatia | 98.2 /100 | #93 | Exceptional $108,304 |
| Sri Lankans | 98.2 /100 | #94 | Exceptional $108,270 |
| Immigrants | Hungary | 98.2 /100 | #95 | Exceptional $108,267 |
| Immigrants | Argentina | 98.2 /100 | #96 | Exceptional $108,264 |