Shoshone vs Tongan Per Capita Income
COMPARE
Shoshone
Tongan
Per Capita Income
Per Capita Income Comparison
Shoshone
Tongans
$37,072
PER CAPITA INCOME
0.1/ 100
METRIC RATING
302nd/ 347
METRIC RANK
$41,693
PER CAPITA INCOME
9.9/ 100
METRIC RATING
216th/ 347
METRIC RANK
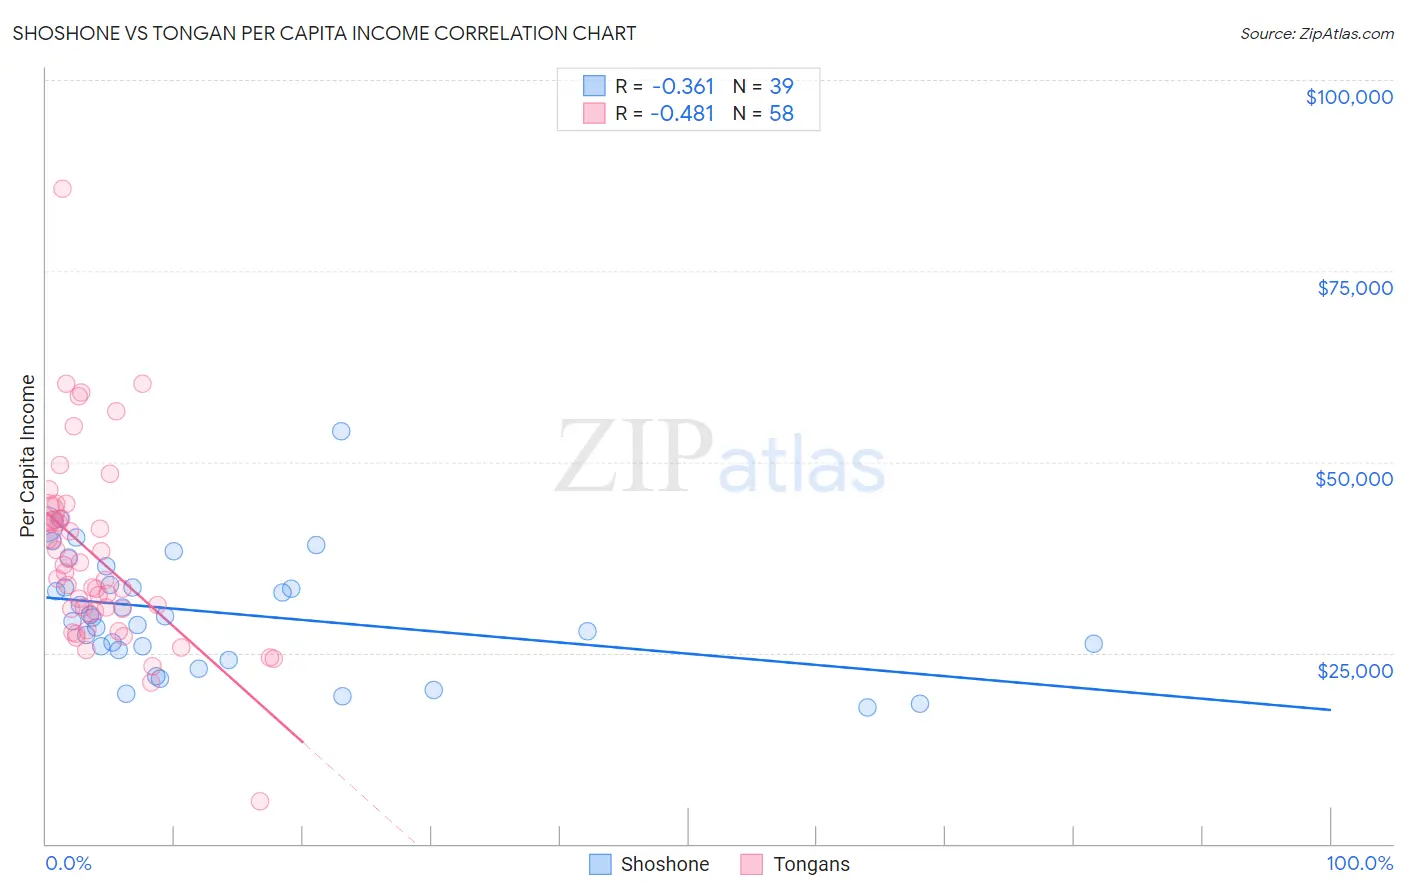
Shoshone vs Tongan Per Capita Income Correlation Chart
The statistical analysis conducted on geographies consisting of 66,627,177 people shows a mild negative correlation between the proportion of Shoshone and per capita income in the United States with a correlation coefficient (R) of -0.361 and weighted average of $37,072. Similarly, the statistical analysis conducted on geographies consisting of 102,908,385 people shows a moderate negative correlation between the proportion of Tongans and per capita income in the United States with a correlation coefficient (R) of -0.481 and weighted average of $41,693, a difference of 12.5%.
Per Capita Income Correlation Summary
| Measurement | Shoshone | Tongan |
| Minimum | $17,814 | $5,622 |
| Maximum | $54,019 | $85,704 |
| Range | $36,205 | $80,082 |
| Mean | $30,204 | $37,644 |
| Median | $29,691 | $35,100 |
| Interquartile 25% (IQ1) | $25,299 | $30,397 |
| Interquartile 75% (IQ3) | $33,868 | $42,507 |
| Interquartile Range (IQR) | $8,569 | $12,110 |
| Standard Deviation (Sample) | $7,800 | $12,429 |
| Standard Deviation (Population) | $7,700 | $12,321 |
Similar Demographics by Per Capita Income
Demographics Similar to Shoshone by Per Capita Income
In terms of per capita income, the demographic groups most similar to Shoshone are Paiute ($37,066, a difference of 0.020%), Ottawa ($37,101, a difference of 0.080%), Honduran ($37,031, a difference of 0.11%), Inupiat ($36,999, a difference of 0.20%), and Immigrants from Bahamas ($37,193, a difference of 0.33%).
| Demographics | Rating | Rank | Per Capita Income |
| Immigrants | Dominican Republic | 0.1 /100 | #295 | Tragic $37,306 |
| Indonesians | 0.1 /100 | #296 | Tragic $37,300 |
| Haitians | 0.1 /100 | #297 | Tragic $37,289 |
| Immigrants | Caribbean | 0.1 /100 | #298 | Tragic $37,254 |
| Cherokee | 0.1 /100 | #299 | Tragic $37,203 |
| Immigrants | Bahamas | 0.1 /100 | #300 | Tragic $37,193 |
| Ottawa | 0.1 /100 | #301 | Tragic $37,101 |
| Shoshone | 0.1 /100 | #302 | Tragic $37,072 |
| Paiute | 0.1 /100 | #303 | Tragic $37,066 |
| Hondurans | 0.1 /100 | #304 | Tragic $37,031 |
| Inupiat | 0.1 /100 | #305 | Tragic $36,999 |
| Immigrants | Haiti | 0.0 /100 | #306 | Tragic $36,849 |
| Immigrants | Latin America | 0.0 /100 | #307 | Tragic $36,823 |
| Fijians | 0.0 /100 | #308 | Tragic $36,690 |
| Immigrants | Honduras | 0.0 /100 | #309 | Tragic $36,665 |
Demographics Similar to Tongans by Per Capita Income
In terms of per capita income, the demographic groups most similar to Tongans are Sudanese ($41,695, a difference of 0.010%), Guamanian/Chamorro ($41,678, a difference of 0.030%), Immigrants from Bangladesh ($41,709, a difference of 0.040%), Immigrants from Venezuela ($41,727, a difference of 0.080%), and Trinidadian and Tobagonian ($41,655, a difference of 0.090%).
| Demographics | Rating | Rank | Per Capita Income |
| Immigrants | Sudan | 13.2 /100 | #209 | Poor $41,986 |
| Ecuadorians | 12.9 /100 | #210 | Poor $41,958 |
| Immigrants | Panama | 11.6 /100 | #211 | Poor $41,853 |
| Immigrants | Senegal | 11.3 /100 | #212 | Poor $41,830 |
| Immigrants | Venezuela | 10.2 /100 | #213 | Poor $41,727 |
| Immigrants | Bangladesh | 10.1 /100 | #214 | Poor $41,709 |
| Sudanese | 9.9 /100 | #215 | Tragic $41,695 |
| Tongans | 9.9 /100 | #216 | Tragic $41,693 |
| Guamanians/Chamorros | 9.7 /100 | #217 | Tragic $41,678 |
| Trinidadians and Tobagonians | 9.5 /100 | #218 | Tragic $41,655 |
| Puget Sound Salish | 8.1 /100 | #219 | Tragic $41,495 |
| Immigrants | Barbados | 7.9 /100 | #220 | Tragic $41,478 |
| Immigrants | Trinidad and Tobago | 7.9 /100 | #221 | Tragic $41,476 |
| Immigrants | Iraq | 7.1 /100 | #222 | Tragic $41,365 |
| Immigrants | Cameroon | 6.8 /100 | #223 | Tragic $41,334 |