Sierra Leonean vs Central American Householder Income Over 65 years
COMPARE
Sierra Leonean
Central American
Householder Income Over 65 years
Householder Income Over 65 years Comparison
Sierra Leoneans
Central Americans
$65,038
HOUSEHOLDER INCOME OVER 65 YEARS
98.6/ 100
METRIC RATING
75th/ 347
METRIC RANK
$56,321
HOUSEHOLDER INCOME OVER 65 YEARS
0.8/ 100
METRIC RATING
246th/ 347
METRIC RANK
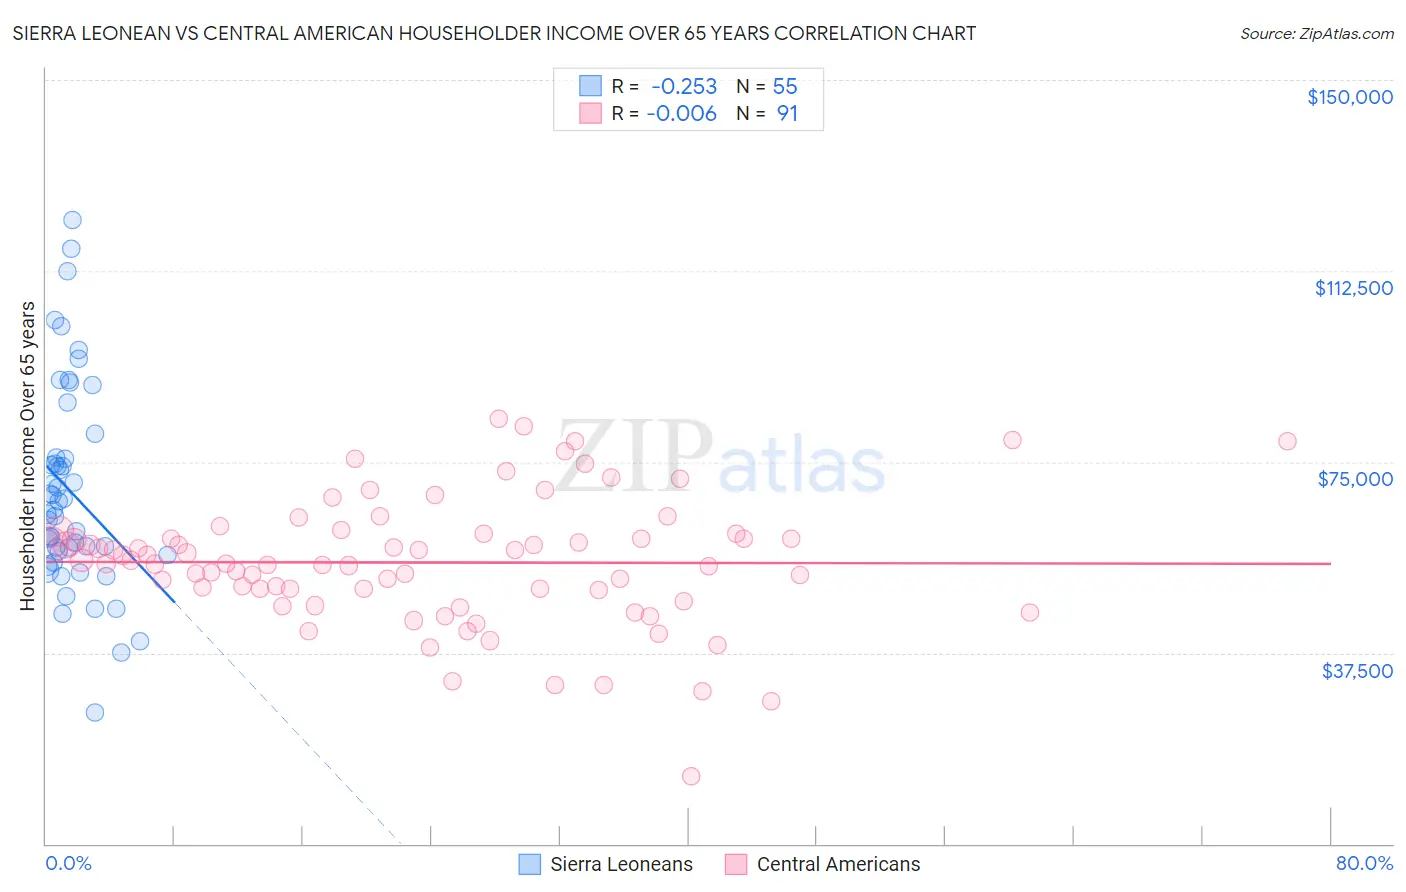
Sierra Leonean vs Central American Householder Income Over 65 years Correlation Chart
The statistical analysis conducted on geographies consisting of 83,245,915 people shows a weak negative correlation between the proportion of Sierra Leoneans and household income with householder over the age of 65 in the United States with a correlation coefficient (R) of -0.253 and weighted average of $65,038. Similarly, the statistical analysis conducted on geographies consisting of 501,593,998 people shows no correlation between the proportion of Central Americans and household income with householder over the age of 65 in the United States with a correlation coefficient (R) of -0.006 and weighted average of $56,321, a difference of 15.5%.
Householder Income Over 65 years Correlation Summary
| Measurement | Sierra Leonean | Central American |
| Minimum | $25,884 | $13,371 |
| Maximum | $122,529 | $83,405 |
| Range | $96,645 | $70,034 |
| Mean | $69,137 | $55,234 |
| Median | $65,524 | $55,069 |
| Interquartile 25% (IQ1) | $56,799 | $49,853 |
| Interquartile 75% (IQ3) | $75,960 | $60,940 |
| Interquartile Range (IQR) | $19,161 | $11,087 |
| Standard Deviation (Sample) | $20,039 | $12,548 |
| Standard Deviation (Population) | $19,856 | $12,479 |
Similar Demographics by Householder Income Over 65 years
Demographics Similar to Sierra Leoneans by Householder Income Over 65 years
In terms of householder income over 65 years, the demographic groups most similar to Sierra Leoneans are Ethiopian ($64,989, a difference of 0.080%), Immigrants from Canada ($64,952, a difference of 0.13%), Immigrants from Western Europe ($64,933, a difference of 0.16%), Hawaiian ($64,920, a difference of 0.18%), and Lithuanian ($65,209, a difference of 0.26%).
| Demographics | Rating | Rank | Householder Income Over 65 years |
| Egyptians | 99.1 /100 | #68 | Exceptional $65,441 |
| Samoans | 99.1 /100 | #69 | Exceptional $65,427 |
| Mongolians | 99.0 /100 | #70 | Exceptional $65,326 |
| Greeks | 98.9 /100 | #71 | Exceptional $65,306 |
| Argentineans | 98.9 /100 | #72 | Exceptional $65,246 |
| Immigrants | Ethiopia | 98.9 /100 | #73 | Exceptional $65,238 |
| Lithuanians | 98.8 /100 | #74 | Exceptional $65,209 |
| Sierra Leoneans | 98.6 /100 | #75 | Exceptional $65,038 |
| Ethiopians | 98.5 /100 | #76 | Exceptional $64,989 |
| Immigrants | Canada | 98.5 /100 | #77 | Exceptional $64,952 |
| Immigrants | Western Europe | 98.5 /100 | #78 | Exceptional $64,933 |
| Hawaiians | 98.4 /100 | #79 | Exceptional $64,920 |
| Immigrants | North America | 98.3 /100 | #80 | Exceptional $64,856 |
| Immigrants | Europe | 98.3 /100 | #81 | Exceptional $64,828 |
| Immigrants | Fiji | 98.2 /100 | #82 | Exceptional $64,795 |
Demographics Similar to Central Americans by Householder Income Over 65 years
In terms of householder income over 65 years, the demographic groups most similar to Central Americans are Immigrants from Uzbekistan ($56,331, a difference of 0.020%), Hmong ($56,339, a difference of 0.030%), Guyanese ($56,351, a difference of 0.050%), Yakama ($56,234, a difference of 0.15%), and Yaqui ($56,417, a difference of 0.17%).
| Demographics | Rating | Rank | Householder Income Over 65 years |
| Immigrants | Laos | 1.2 /100 | #239 | Tragic $56,722 |
| Sub-Saharan Africans | 1.0 /100 | #240 | Tragic $56,615 |
| Immigrants | Guyana | 0.9 /100 | #241 | Tragic $56,495 |
| Yaqui | 0.8 /100 | #242 | Tragic $56,417 |
| Guyanese | 0.8 /100 | #243 | Tragic $56,351 |
| Hmong | 0.8 /100 | #244 | Tragic $56,339 |
| Immigrants | Uzbekistan | 0.8 /100 | #245 | Tragic $56,331 |
| Central Americans | 0.8 /100 | #246 | Tragic $56,321 |
| Yakama | 0.7 /100 | #247 | Tragic $56,234 |
| Vietnamese | 0.6 /100 | #248 | Tragic $56,143 |
| Mexican American Indians | 0.6 /100 | #249 | Tragic $56,089 |
| Immigrants | Bosnia and Herzegovina | 0.5 /100 | #250 | Tragic $55,986 |
| Immigrants | Portugal | 0.5 /100 | #251 | Tragic $55,924 |
| Osage | 0.4 /100 | #252 | Tragic $55,677 |
| Immigrants | Trinidad and Tobago | 0.4 /100 | #253 | Tragic $55,598 |