South American Indian vs Immigrants from Jamaica Householder Income Under 25 years
COMPARE
South American Indian
Immigrants from Jamaica
Householder Income Under 25 years
Householder Income Under 25 years Comparison
South American Indians
Immigrants from Jamaica
$52,979
HOUSEHOLDER INCOME UNDER 25 YEARS
87.3/ 100
METRIC RATING
144th/ 347
METRIC RANK
$51,038
HOUSEHOLDER INCOME UNDER 25 YEARS
5.6/ 100
METRIC RATING
225th/ 347
METRIC RANK
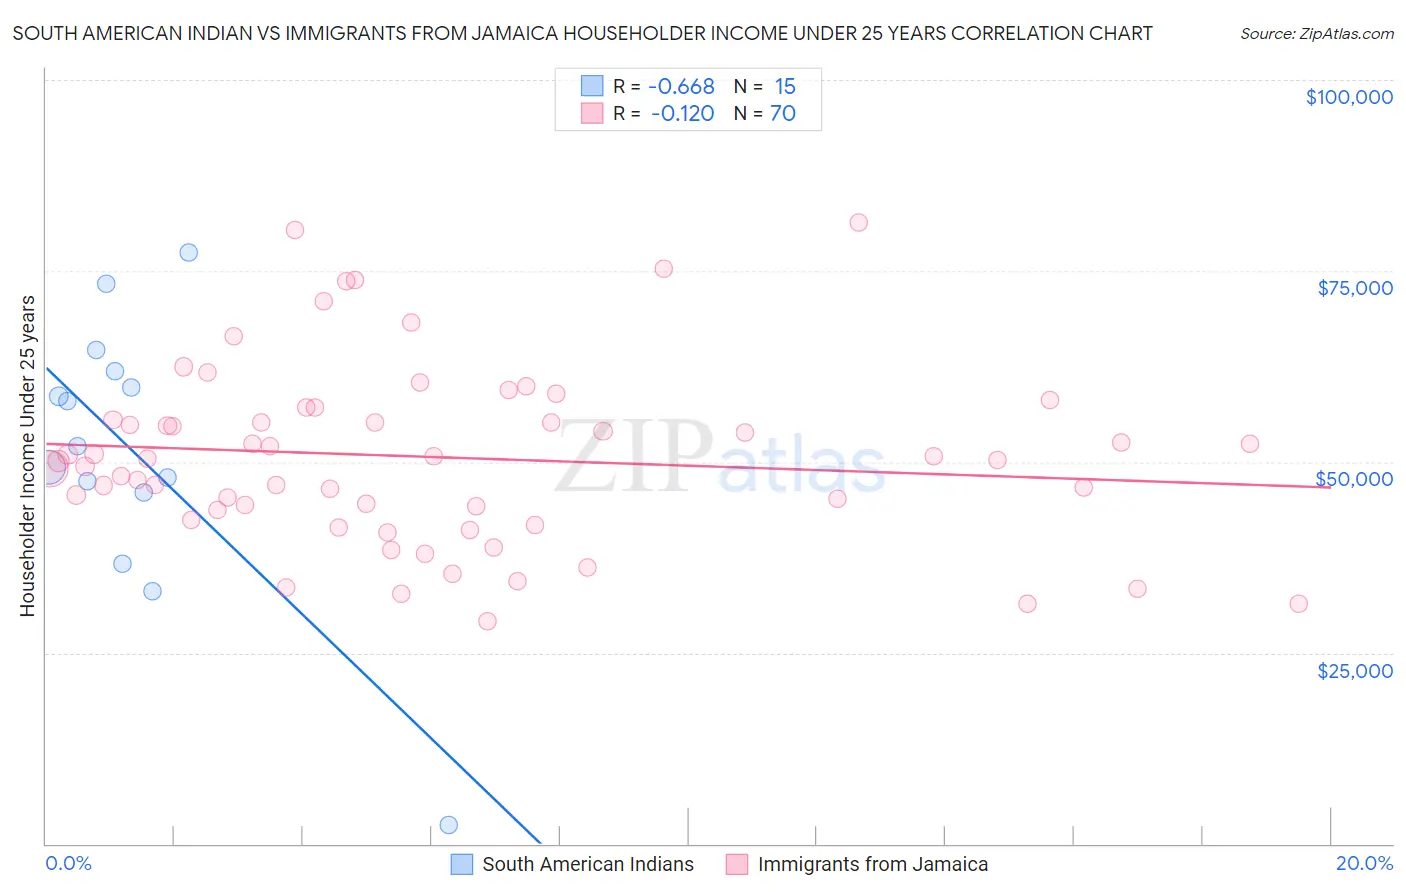
South American Indian vs Immigrants from Jamaica Householder Income Under 25 years Correlation Chart
The statistical analysis conducted on geographies consisting of 149,724,736 people shows a significant negative correlation between the proportion of South American Indians and household income with householder under the age of 25 in the United States with a correlation coefficient (R) of -0.668 and weighted average of $52,979. Similarly, the statistical analysis conducted on geographies consisting of 257,803,816 people shows a poor negative correlation between the proportion of Immigrants from Jamaica and household income with householder under the age of 25 in the United States with a correlation coefficient (R) of -0.120 and weighted average of $51,038, a difference of 3.8%.
Householder Income Under 25 years Correlation Summary
| Measurement | South American Indian | Immigrants from Jamaica |
| Minimum | $2,499 | $29,211 |
| Maximum | $77,389 | $81,354 |
| Range | $74,890 | $52,143 |
| Mean | $51,232 | $50,619 |
| Median | $52,040 | $50,278 |
| Interquartile 25% (IQ1) | $45,962 | $43,769 |
| Interquartile 75% (IQ3) | $61,870 | $55,499 |
| Interquartile Range (IQR) | $15,908 | $11,730 |
| Standard Deviation (Sample) | $18,152 | $11,678 |
| Standard Deviation (Population) | $17,536 | $11,594 |
Similar Demographics by Householder Income Under 25 years
Demographics Similar to South American Indians by Householder Income Under 25 years
In terms of householder income under 25 years, the demographic groups most similar to South American Indians are Immigrants from Armenia ($52,986, a difference of 0.010%), Swedish ($52,986, a difference of 0.010%), Immigrants from Western Europe ($52,957, a difference of 0.040%), Danish ($53,041, a difference of 0.12%), and Hawaiian ($53,078, a difference of 0.19%).
| Demographics | Rating | Rank | Householder Income Under 25 years |
| Immigrants | Barbados | 91.5 /100 | #137 | Exceptional $53,163 |
| Norwegians | 90.8 /100 | #138 | Exceptional $53,127 |
| Costa Ricans | 90.4 /100 | #139 | Exceptional $53,106 |
| Hawaiians | 89.8 /100 | #140 | Excellent $53,078 |
| Danes | 88.9 /100 | #141 | Excellent $53,041 |
| Immigrants | Armenia | 87.5 /100 | #142 | Excellent $52,986 |
| Swedes | 87.5 /100 | #143 | Excellent $52,986 |
| South American Indians | 87.3 /100 | #144 | Excellent $52,979 |
| Immigrants | Western Europe | 86.7 /100 | #145 | Excellent $52,957 |
| Immigrants | Hungary | 81.6 /100 | #146 | Excellent $52,798 |
| Latvians | 81.0 /100 | #147 | Excellent $52,783 |
| French Canadians | 76.5 /100 | #148 | Good $52,672 |
| Scandinavians | 75.7 /100 | #149 | Good $52,654 |
| Immigrants | Costa Rica | 75.2 /100 | #150 | Good $52,643 |
| Immigrants | Scotland | 75.0 /100 | #151 | Good $52,638 |
Demographics Similar to Immigrants from Jamaica by Householder Income Under 25 years
In terms of householder income under 25 years, the demographic groups most similar to Immigrants from Jamaica are Yugoslavian ($51,028, a difference of 0.020%), Immigrants from Central America ($51,022, a difference of 0.030%), Belizean ($51,094, a difference of 0.11%), Immigrants from Norway ($50,984, a difference of 0.11%), and Serbian ($51,106, a difference of 0.13%).
| Demographics | Rating | Rank | Householder Income Under 25 years |
| Immigrants | Belize | 8.6 /100 | #218 | Tragic $51,223 |
| Arabs | 8.5 /100 | #219 | Tragic $51,219 |
| Immigrants | Germany | 8.0 /100 | #220 | Tragic $51,190 |
| Immigrants | Eastern Africa | 7.4 /100 | #221 | Tragic $51,158 |
| Spaniards | 6.8 /100 | #222 | Tragic $51,117 |
| Serbians | 6.6 /100 | #223 | Tragic $51,106 |
| Belizeans | 6.4 /100 | #224 | Tragic $51,094 |
| Immigrants | Jamaica | 5.6 /100 | #225 | Tragic $51,038 |
| Yugoslavians | 5.5 /100 | #226 | Tragic $51,028 |
| Immigrants | Central America | 5.4 /100 | #227 | Tragic $51,022 |
| Immigrants | Norway | 5.0 /100 | #228 | Tragic $50,984 |
| Yuman | 4.4 /100 | #229 | Tragic $50,933 |
| Jamaicans | 4.4 /100 | #230 | Tragic $50,929 |
| Ugandans | 4.3 /100 | #231 | Tragic $50,923 |
| Slovenes | 4.0 /100 | #232 | Tragic $50,886 |