South American Indian vs Kiowa Wage/Income Gap
COMPARE
South American Indian
Kiowa
Wage/Income Gap
Wage/Income Gap Comparison
South American Indians
Kiowa
24.7%
WAGE/INCOME GAP
92.0/ 100
METRIC RATING
135th/ 347
METRIC RANK
23.6%
WAGE/INCOME GAP
99.4/ 100
METRIC RATING
96th/ 347
METRIC RANK
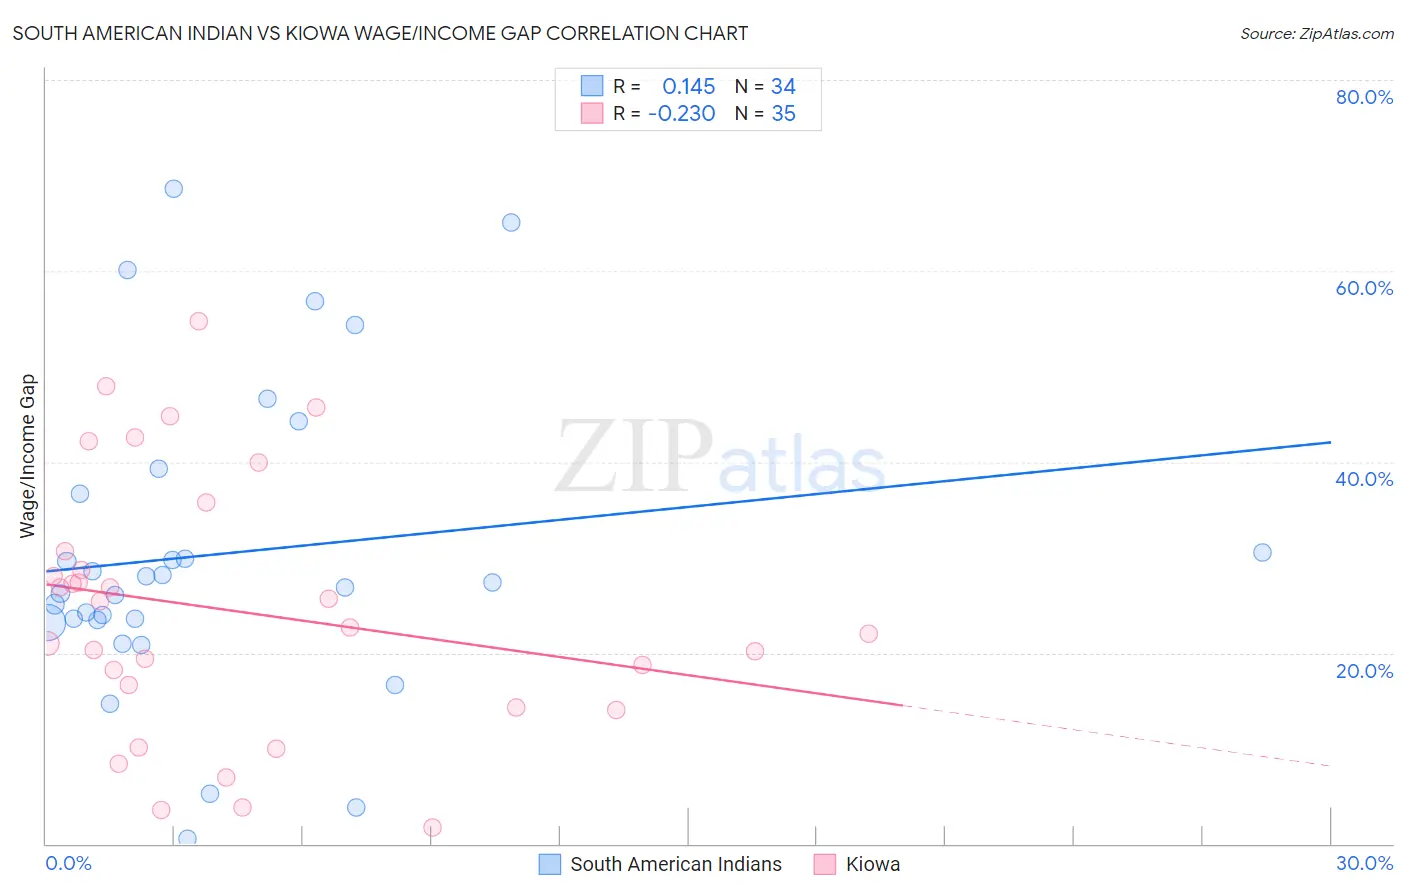
South American Indian vs Kiowa Wage/Income Gap Correlation Chart
The statistical analysis conducted on geographies consisting of 164,540,289 people shows a poor positive correlation between the proportion of South American Indians and wage/income gap percentage in the United States with a correlation coefficient (R) of 0.145 and weighted average of 24.7%. Similarly, the statistical analysis conducted on geographies consisting of 56,090,422 people shows a weak negative correlation between the proportion of Kiowa and wage/income gap percentage in the United States with a correlation coefficient (R) of -0.230 and weighted average of 23.6%, a difference of 4.8%.
Wage/Income Gap Correlation Summary
| Measurement | South American Indian | Kiowa |
| Minimum | 0.52% | 1.7% |
| Maximum | 68.7% | 54.7% |
| Range | 68.1% | 53.0% |
| Mean | 30.4% | 24.3% |
| Median | 27.1% | 22.6% |
| Interquartile 25% (IQ1) | 23.4% | 14.2% |
| Interquartile 75% (IQ3) | 36.7% | 30.6% |
| Interquartile Range (IQR) | 13.2% | 16.4% |
| Standard Deviation (Sample) | 16.2% | 13.5% |
| Standard Deviation (Population) | 15.9% | 13.3% |
Similar Demographics by Wage/Income Gap
Demographics Similar to South American Indians by Wage/Income Gap
In terms of wage/income gap, the demographic groups most similar to South American Indians are Mexican American Indian (24.7%, a difference of 0.060%), Colombian (24.7%, a difference of 0.090%), Immigrants from Costa Rica (24.7%, a difference of 0.10%), Armenian (24.8%, a difference of 0.14%), and Immigrants from South Eastern Asia (24.8%, a difference of 0.23%).
| Demographics | Rating | Rank | Wage/Income Gap |
| Immigrants | Central America | 93.5 /100 | #128 | Exceptional 24.6% |
| Yup'ik | 93.3 /100 | #129 | Exceptional 24.7% |
| Alsatians | 93.2 /100 | #130 | Exceptional 24.7% |
| Immigrants | Philippines | 93.0 /100 | #131 | Exceptional 24.7% |
| Immigrants | Costa Rica | 92.4 /100 | #132 | Exceptional 24.7% |
| Colombians | 92.4 /100 | #133 | Exceptional 24.7% |
| Mexican American Indians | 92.2 /100 | #134 | Exceptional 24.7% |
| South American Indians | 92.0 /100 | #135 | Exceptional 24.7% |
| Armenians | 91.3 /100 | #136 | Exceptional 24.8% |
| Immigrants | South Eastern Asia | 90.9 /100 | #137 | Exceptional 24.8% |
| Immigrants | Bosnia and Herzegovina | 90.1 /100 | #138 | Exceptional 24.8% |
| Hispanics or Latinos | 89.5 /100 | #139 | Excellent 24.9% |
| Immigrants | Nepal | 89.3 /100 | #140 | Excellent 24.9% |
| Hawaiians | 89.3 /100 | #141 | Excellent 24.9% |
| Afghans | 88.1 /100 | #142 | Excellent 24.9% |
Demographics Similar to Kiowa by Wage/Income Gap
In terms of wage/income gap, the demographic groups most similar to Kiowa are Immigrants from Sudan (23.6%, a difference of 0.090%), Cape Verdean (23.6%, a difference of 0.12%), Honduran (23.6%, a difference of 0.15%), Immigrants from Cabo Verde (23.6%, a difference of 0.24%), and Immigrants from Latin America (23.7%, a difference of 0.48%).
| Demographics | Rating | Rank | Wage/Income Gap |
| Marshallese | 99.6 /100 | #89 | Exceptional 23.4% |
| Nicaraguans | 99.6 /100 | #90 | Exceptional 23.4% |
| Arapaho | 99.6 /100 | #91 | Exceptional 23.5% |
| Immigrants | Honduras | 99.5 /100 | #92 | Exceptional 23.5% |
| Immigrants | Cabo Verde | 99.5 /100 | #93 | Exceptional 23.6% |
| Hondurans | 99.5 /100 | #94 | Exceptional 23.6% |
| Cape Verdeans | 99.4 /100 | #95 | Exceptional 23.6% |
| Kiowa | 99.4 /100 | #96 | Exceptional 23.6% |
| Immigrants | Sudan | 99.4 /100 | #97 | Exceptional 23.6% |
| Immigrants | Latin America | 99.2 /100 | #98 | Exceptional 23.7% |
| Aleuts | 99.2 /100 | #99 | Exceptional 23.7% |
| Yakama | 99.2 /100 | #100 | Exceptional 23.7% |
| Japanese | 99.1 /100 | #101 | Exceptional 23.8% |
| Immigrants | Laos | 99.0 /100 | #102 | Exceptional 23.8% |
| Tsimshian | 98.9 /100 | #103 | Exceptional 23.9% |