Soviet Union vs South American Indian Median Earnings
COMPARE
Soviet Union
South American Indian
Median Earnings
Median Earnings Comparison
Soviet Union
South American Indians
$54,290
MEDIAN EARNINGS
100.0/ 100
METRIC RATING
24th/ 347
METRIC RANK
$46,952
MEDIAN EARNINGS
67.4/ 100
METRIC RATING
162nd/ 347
METRIC RANK
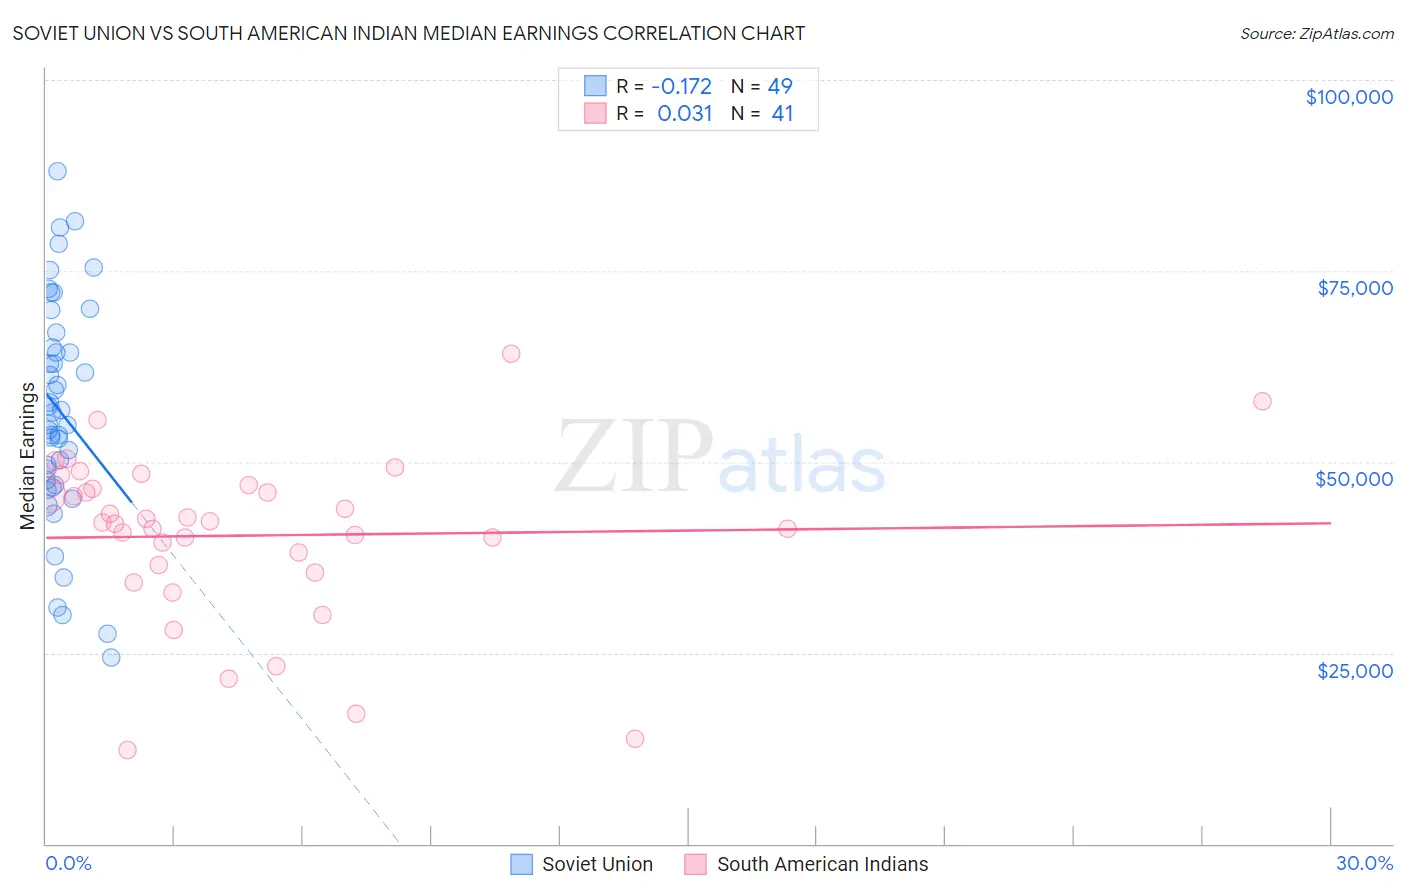
Soviet Union vs South American Indian Median Earnings Correlation Chart
The statistical analysis conducted on geographies consisting of 43,511,973 people shows a poor negative correlation between the proportion of Soviet Union and median earnings in the United States with a correlation coefficient (R) of -0.172 and weighted average of $54,290. Similarly, the statistical analysis conducted on geographies consisting of 164,566,845 people shows no correlation between the proportion of South American Indians and median earnings in the United States with a correlation coefficient (R) of 0.031 and weighted average of $46,952, a difference of 15.6%.
Median Earnings Correlation Summary
| Measurement | Soviet Union | South American Indian |
| Minimum | $24,432 | $12,289 |
| Maximum | $88,077 | $64,091 |
| Range | $63,645 | $51,802 |
| Mean | $56,673 | $40,352 |
| Median | $56,451 | $41,992 |
| Interquartile 25% (IQ1) | $47,287 | $35,978 |
| Interquartile 75% (IQ3) | $65,993 | $46,744 |
| Interquartile Range (IQR) | $18,706 | $10,766 |
| Standard Deviation (Sample) | $14,478 | $11,075 |
| Standard Deviation (Population) | $14,329 | $10,940 |
Similar Demographics by Median Earnings
Demographics Similar to Soviet Union by Median Earnings
In terms of median earnings, the demographic groups most similar to Soviet Union are Immigrants from Sweden ($54,478, a difference of 0.35%), Immigrants from Korea ($54,530, a difference of 0.44%), Burmese ($54,559, a difference of 0.50%), Cypriot ($54,589, a difference of 0.55%), and Turkish ($53,919, a difference of 0.69%).
| Demographics | Rating | Rank | Median Earnings |
| Eastern Europeans | 100.0 /100 | #17 | Exceptional $55,084 |
| Immigrants | Japan | 100.0 /100 | #18 | Exceptional $54,938 |
| Immigrants | Belgium | 100.0 /100 | #19 | Exceptional $54,679 |
| Cypriots | 100.0 /100 | #20 | Exceptional $54,589 |
| Burmese | 100.0 /100 | #21 | Exceptional $54,559 |
| Immigrants | Korea | 100.0 /100 | #22 | Exceptional $54,530 |
| Immigrants | Sweden | 100.0 /100 | #23 | Exceptional $54,478 |
| Soviet Union | 100.0 /100 | #24 | Exceptional $54,290 |
| Turks | 100.0 /100 | #25 | Exceptional $53,919 |
| Immigrants | Northern Europe | 100.0 /100 | #26 | Exceptional $53,872 |
| Asians | 100.0 /100 | #27 | Exceptional $53,690 |
| Immigrants | France | 100.0 /100 | #28 | Exceptional $53,490 |
| Immigrants | Russia | 100.0 /100 | #29 | Exceptional $53,457 |
| Cambodians | 100.0 /100 | #30 | Exceptional $53,386 |
| Russians | 100.0 /100 | #31 | Exceptional $53,334 |
Demographics Similar to South American Indians by Median Earnings
In terms of median earnings, the demographic groups most similar to South American Indians are Immigrants from Eastern Africa ($46,969, a difference of 0.040%), Icelander ($46,916, a difference of 0.080%), Alsatian ($47,023, a difference of 0.15%), Immigrants from Peru ($47,025, a difference of 0.16%), and Norwegian ($46,865, a difference of 0.18%).
| Demographics | Rating | Rank | Median Earnings |
| Immigrants | Vietnam | 76.7 /100 | #155 | Good $47,282 |
| Irish | 76.6 /100 | #156 | Good $47,276 |
| Czechs | 75.1 /100 | #157 | Good $47,221 |
| Slovaks | 71.7 /100 | #158 | Good $47,095 |
| Immigrants | Peru | 69.6 /100 | #159 | Good $47,025 |
| Alsatians | 69.6 /100 | #160 | Good $47,023 |
| Immigrants | Eastern Africa | 68.0 /100 | #161 | Good $46,969 |
| South American Indians | 67.4 /100 | #162 | Good $46,952 |
| Icelanders | 66.3 /100 | #163 | Good $46,916 |
| Norwegians | 64.7 /100 | #164 | Good $46,865 |
| South Americans | 62.7 /100 | #165 | Good $46,804 |
| Czechoslovakians | 57.8 /100 | #166 | Average $46,658 |
| Costa Ricans | 57.4 /100 | #167 | Average $46,645 |
| Immigrants | Africa | 54.6 /100 | #168 | Average $46,564 |
| Immigrants | South America | 54.0 /100 | #169 | Average $46,548 |