Spanish American Indian vs Immigrants from Asia Householder Income Under 25 years
COMPARE
Spanish American Indian
Immigrants from Asia
Householder Income Under 25 years
Householder Income Under 25 years Comparison
Spanish American Indians
Immigrants from Asia
$55,573
HOUSEHOLDER INCOME UNDER 25 YEARS
100.0/ 100
METRIC RATING
45th/ 347
METRIC RANK
$56,379
HOUSEHOLDER INCOME UNDER 25 YEARS
100.0/ 100
METRIC RATING
29th/ 347
METRIC RANK
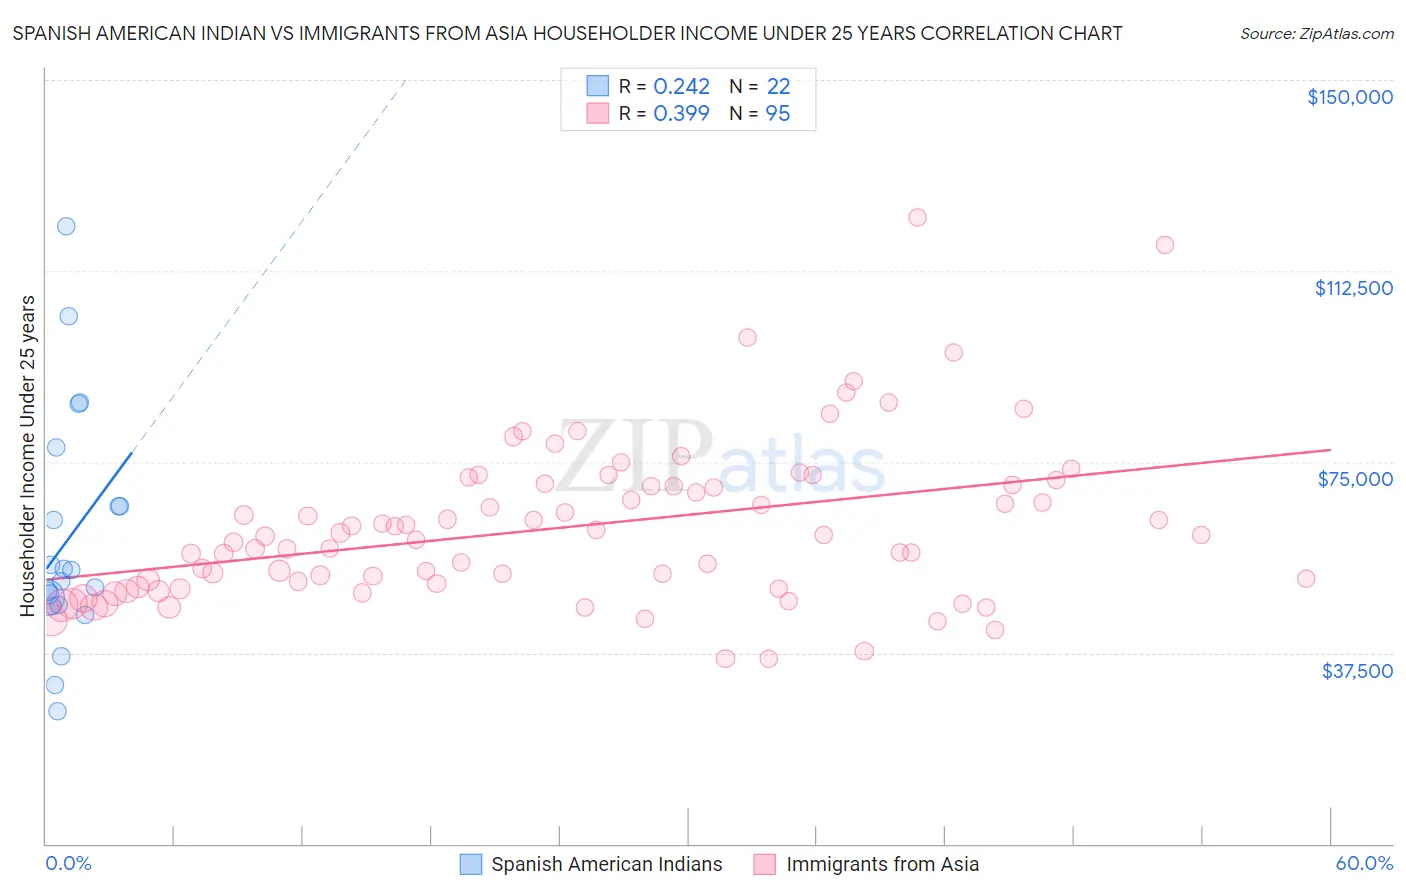
Spanish American Indian vs Immigrants from Asia Householder Income Under 25 years Correlation Chart
The statistical analysis conducted on geographies consisting of 69,838,051 people shows a weak positive correlation between the proportion of Spanish American Indians and household income with householder under the age of 25 in the United States with a correlation coefficient (R) of 0.242 and weighted average of $55,573. Similarly, the statistical analysis conducted on geographies consisting of 431,606,279 people shows a mild positive correlation between the proportion of Immigrants from Asia and household income with householder under the age of 25 in the United States with a correlation coefficient (R) of 0.399 and weighted average of $56,379, a difference of 1.5%.
Householder Income Under 25 years Correlation Summary
| Measurement | Spanish American Indian | Immigrants from Asia |
| Minimum | $26,095 | $36,244 |
| Maximum | $121,305 | $123,022 |
| Range | $95,210 | $86,778 |
| Mean | $59,799 | $62,236 |
| Median | $52,673 | $60,309 |
| Interquartile 25% (IQ1) | $46,974 | $50,431 |
| Interquartile 75% (IQ3) | $66,250 | $70,461 |
| Interquartile Range (IQR) | $19,276 | $20,030 |
| Standard Deviation (Sample) | $23,098 | $15,817 |
| Standard Deviation (Population) | $22,567 | $15,733 |
Demographics Similar to Spanish American Indians and Immigrants from Asia by Householder Income Under 25 years
In terms of householder income under 25 years, the demographic groups most similar to Spanish American Indians are Immigrants from Eastern Europe ($55,572, a difference of 0.0%), Cambodian ($55,571, a difference of 0.0%), Paraguayan ($55,614, a difference of 0.070%), Immigrants from South Eastern Asia ($55,714, a difference of 0.25%), and Immigrants from Korea ($55,716, a difference of 0.26%). Similarly, the demographic groups most similar to Immigrants from Asia are Immigrants from Peru ($56,384, a difference of 0.010%), Immigrants from North Macedonia ($56,503, a difference of 0.22%), Immigrants from Moldova ($56,168, a difference of 0.37%), Vietnamese ($56,127, a difference of 0.45%), and Peruvian ($56,052, a difference of 0.58%).
| Demographics | Rating | Rank | Householder Income Under 25 years |
| Immigrants | North Macedonia | 100.0 /100 | #27 | Exceptional $56,503 |
| Immigrants | Peru | 100.0 /100 | #28 | Exceptional $56,384 |
| Immigrants | Asia | 100.0 /100 | #29 | Exceptional $56,379 |
| Immigrants | Moldova | 100.0 /100 | #30 | Exceptional $56,168 |
| Vietnamese | 100.0 /100 | #31 | Exceptional $56,127 |
| Peruvians | 100.0 /100 | #32 | Exceptional $56,052 |
| Inupiat | 100.0 /100 | #33 | Exceptional $55,935 |
| Immigrants | Japan | 100.0 /100 | #34 | Exceptional $55,932 |
| Tlingit-Haida | 100.0 /100 | #35 | Exceptional $55,914 |
| Immigrants | Israel | 100.0 /100 | #36 | Exceptional $55,913 |
| Immigrants | Russia | 100.0 /100 | #37 | Exceptional $55,891 |
| Immigrants | Iran | 100.0 /100 | #38 | Exceptional $55,880 |
| Immigrants | Belarus | 100.0 /100 | #39 | Exceptional $55,743 |
| Immigrants | Greece | 100.0 /100 | #40 | Exceptional $55,727 |
| Immigrants | Guyana | 100.0 /100 | #41 | Exceptional $55,726 |
| Immigrants | Korea | 100.0 /100 | #42 | Exceptional $55,716 |
| Immigrants | South Eastern Asia | 100.0 /100 | #43 | Exceptional $55,714 |
| Paraguayans | 100.0 /100 | #44 | Exceptional $55,614 |
| Spanish American Indians | 100.0 /100 | #45 | Exceptional $55,573 |
| Immigrants | Eastern Europe | 100.0 /100 | #46 | Exceptional $55,572 |
| Cambodians | 100.0 /100 | #47 | Exceptional $55,571 |