Spanish vs Belgian Median Female Earnings
COMPARE
Spanish
Belgian
Median Female Earnings
Median Female Earnings Comparison
Spanish
Belgians
$38,098
MEDIAN FEMALE EARNINGS
3.5/ 100
METRIC RATING
241st/ 347
METRIC RANK
$38,382
MEDIAN FEMALE EARNINGS
6.1/ 100
METRIC RATING
229th/ 347
METRIC RANK
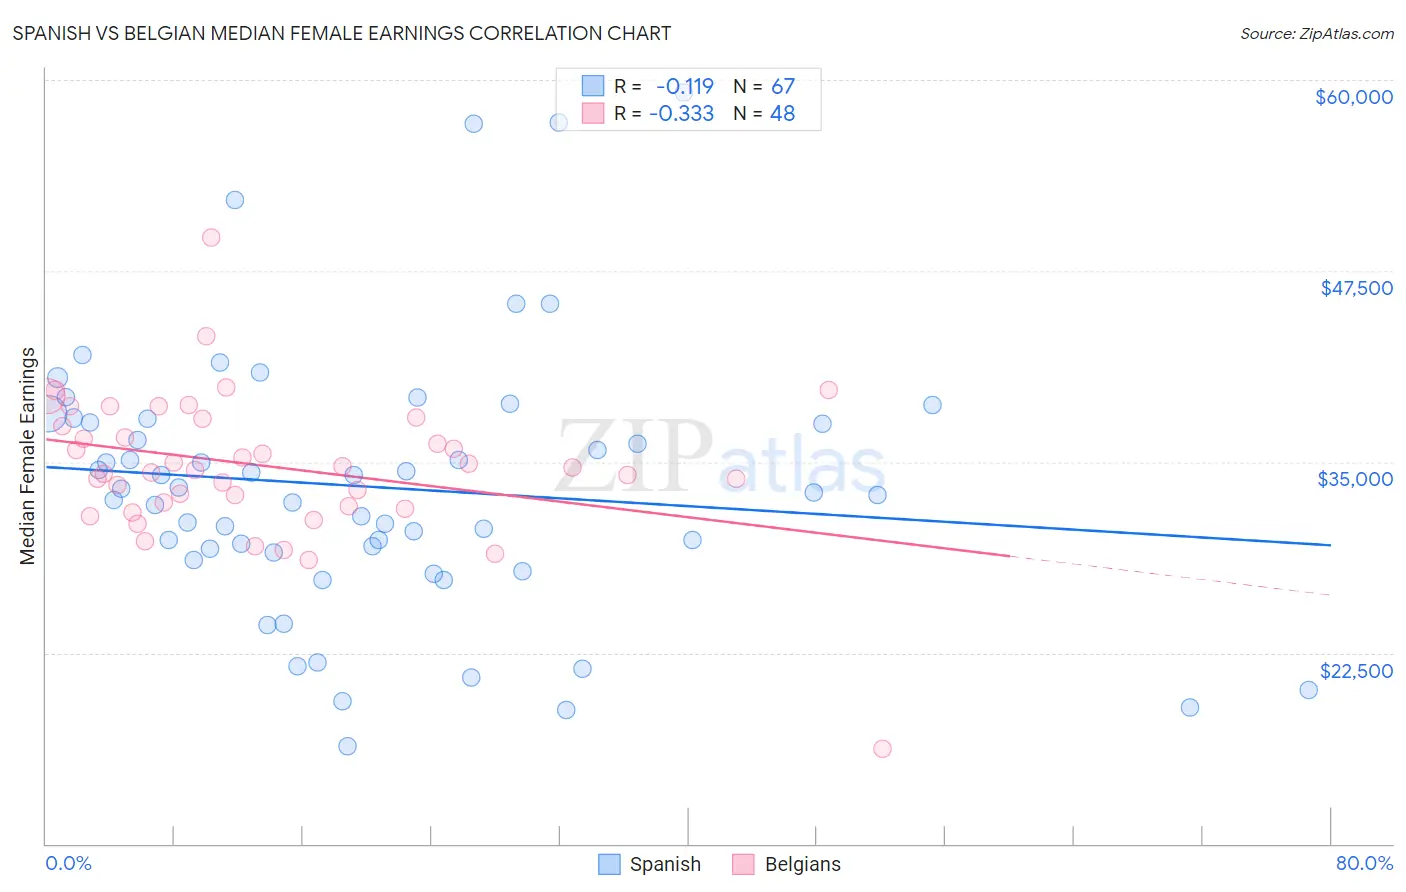
Spanish vs Belgian Median Female Earnings Correlation Chart
The statistical analysis conducted on geographies consisting of 421,897,645 people shows a poor negative correlation between the proportion of Spanish and median female earnings in the United States with a correlation coefficient (R) of -0.119 and weighted average of $38,098. Similarly, the statistical analysis conducted on geographies consisting of 355,862,311 people shows a mild negative correlation between the proportion of Belgians and median female earnings in the United States with a correlation coefficient (R) of -0.333 and weighted average of $38,382, a difference of 0.75%.
Median Female Earnings Correlation Summary
| Measurement | Spanish | Belgian |
| Minimum | $16,357 | $16,250 |
| Maximum | $59,157 | $49,724 |
| Range | $42,800 | $33,474 |
| Mean | $33,351 | $34,687 |
| Median | $33,021 | $34,563 |
| Interquartile 25% (IQ1) | $29,054 | $32,227 |
| Interquartile 75% (IQ3) | $37,790 | $37,577 |
| Interquartile Range (IQR) | $8,737 | $5,350 |
| Standard Deviation (Sample) | $8,760 | $4,773 |
| Standard Deviation (Population) | $8,694 | $4,723 |
Demographics Similar to Spanish and Belgians by Median Female Earnings
In terms of median female earnings, the demographic groups most similar to Spanish are Immigrants from Burma/Myanmar ($38,028, a difference of 0.18%), Finnish ($38,173, a difference of 0.20%), English ($38,196, a difference of 0.26%), Alaska Native ($38,202, a difference of 0.27%), and Immigrants from Cabo Verde ($38,208, a difference of 0.29%). Similarly, the demographic groups most similar to Belgians are Subsaharan African ($38,391, a difference of 0.020%), Scottish ($38,397, a difference of 0.040%), Basque ($38,352, a difference of 0.080%), Somali ($38,333, a difference of 0.13%), and French Canadian ($38,436, a difference of 0.14%).
| Demographics | Rating | Rank | Median Female Earnings |
| French | 7.0 /100 | #225 | Tragic $38,457 |
| French Canadians | 6.8 /100 | #226 | Tragic $38,436 |
| Scottish | 6.3 /100 | #227 | Tragic $38,397 |
| Sub-Saharan Africans | 6.2 /100 | #228 | Tragic $38,391 |
| Belgians | 6.1 /100 | #229 | Tragic $38,382 |
| Basques | 5.7 /100 | #230 | Tragic $38,352 |
| Somalis | 5.5 /100 | #231 | Tragic $38,333 |
| Scandinavians | 5.2 /100 | #232 | Tragic $38,306 |
| Tongans | 5.1 /100 | #233 | Tragic $38,288 |
| Celtics | 5.0 /100 | #234 | Tragic $38,283 |
| Sudanese | 4.4 /100 | #235 | Tragic $38,215 |
| Liberians | 4.4 /100 | #236 | Tragic $38,215 |
| Immigrants | Cabo Verde | 4.3 /100 | #237 | Tragic $38,208 |
| Alaska Natives | 4.3 /100 | #238 | Tragic $38,202 |
| English | 4.2 /100 | #239 | Tragic $38,196 |
| Finns | 4.0 /100 | #240 | Tragic $38,173 |
| Spanish | 3.5 /100 | #241 | Tragic $38,098 |
| Immigrants | Burma/Myanmar | 3.0 /100 | #242 | Tragic $38,028 |
| Germans | 2.8 /100 | #243 | Tragic $37,986 |
| Immigrants | Liberia | 2.7 /100 | #244 | Tragic $37,970 |
| Immigrants | Middle Africa | 2.7 /100 | #245 | Tragic $37,965 |