Sudanese vs Indonesian Householder Income Over 65 years
COMPARE
Sudanese
Indonesian
Householder Income Over 65 years
Householder Income Over 65 years Comparison
Sudanese
Indonesians
$58,281
HOUSEHOLDER INCOME OVER 65 YEARS
5.7/ 100
METRIC RATING
217th/ 347
METRIC RANK
$54,176
HOUSEHOLDER INCOME OVER 65 YEARS
0.1/ 100
METRIC RATING
273rd/ 347
METRIC RANK
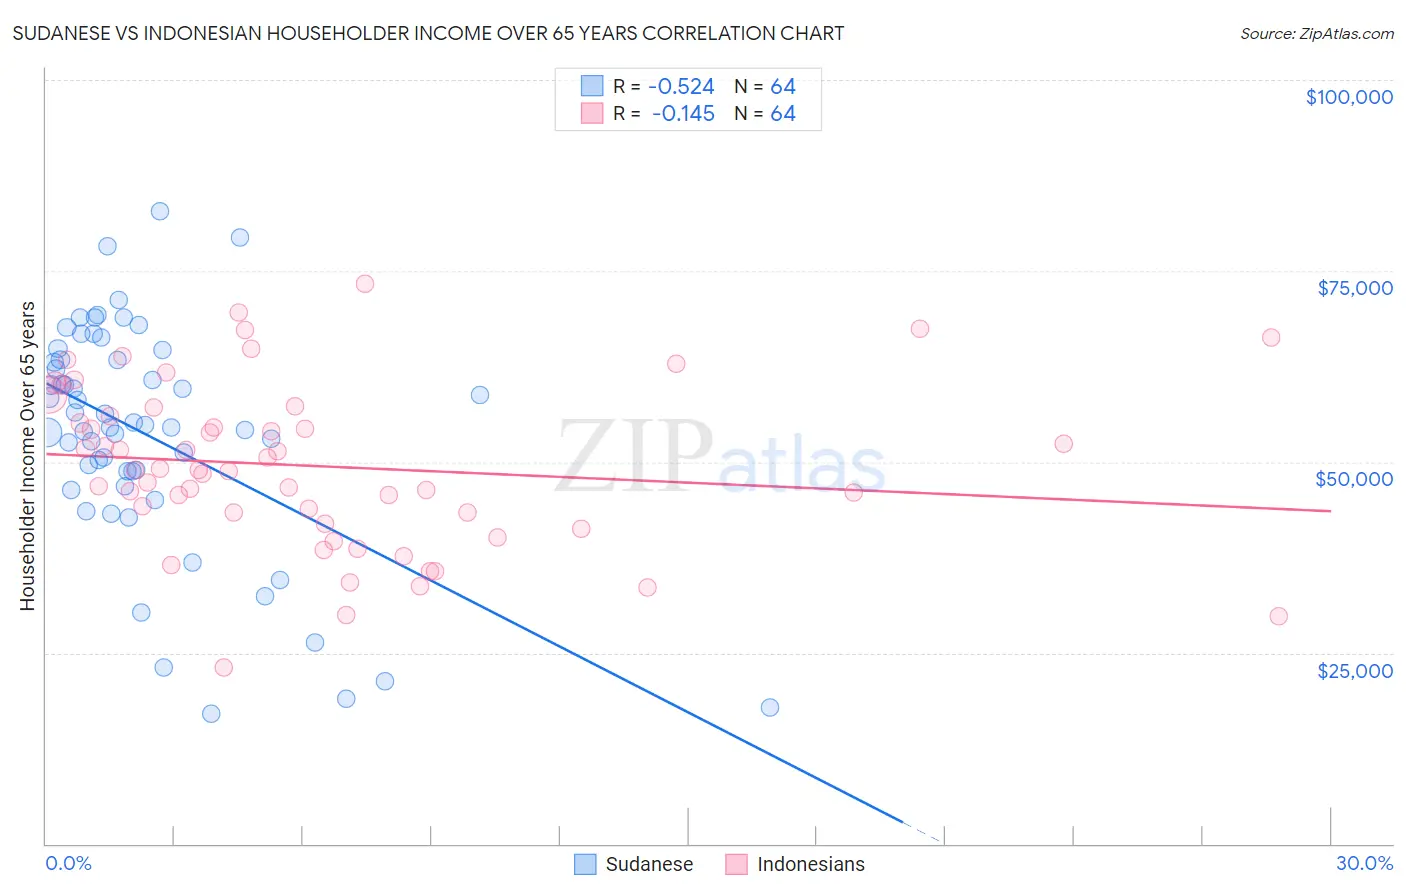
Sudanese vs Indonesian Householder Income Over 65 years Correlation Chart
The statistical analysis conducted on geographies consisting of 109,968,006 people shows a substantial negative correlation between the proportion of Sudanese and household income with householder over the age of 65 in the United States with a correlation coefficient (R) of -0.524 and weighted average of $58,281. Similarly, the statistical analysis conducted on geographies consisting of 162,395,174 people shows a poor negative correlation between the proportion of Indonesians and household income with householder over the age of 65 in the United States with a correlation coefficient (R) of -0.145 and weighted average of $54,176, a difference of 7.6%.
Householder Income Over 65 years Correlation Summary
| Measurement | Sudanese | Indonesian |
| Minimum | $17,083 | $23,126 |
| Maximum | $82,774 | $73,361 |
| Range | $65,691 | $50,235 |
| Mean | $53,447 | $49,441 |
| Median | $54,692 | $48,888 |
| Interquartile 25% (IQ1) | $47,752 | $42,656 |
| Interquartile 75% (IQ3) | $63,414 | $56,577 |
| Interquartile Range (IQR) | $15,662 | $13,920 |
| Standard Deviation (Sample) | $14,913 | $10,775 |
| Standard Deviation (Population) | $14,796 | $10,690 |
Similar Demographics by Householder Income Over 65 years
Demographics Similar to Sudanese by Householder Income Over 65 years
In terms of householder income over 65 years, the demographic groups most similar to Sudanese are Panamanian ($58,266, a difference of 0.030%), Malaysian ($58,244, a difference of 0.060%), Yugoslavian ($58,243, a difference of 0.070%), Immigrants from El Salvador ($58,226, a difference of 0.10%), and Delaware ($58,214, a difference of 0.11%).
| Demographics | Rating | Rank | Householder Income Over 65 years |
| Nigerians | 11.2 /100 | #210 | Poor $58,992 |
| Immigrants | Nigeria | 10.7 /100 | #211 | Poor $58,942 |
| Colombians | 9.8 /100 | #212 | Tragic $58,851 |
| Whites/Caucasians | 9.8 /100 | #213 | Tragic $58,847 |
| Nepalese | 9.0 /100 | #214 | Tragic $58,761 |
| Immigrants | Ghana | 7.9 /100 | #215 | Tragic $58,624 |
| Immigrants | Middle Africa | 6.2 /100 | #216 | Tragic $58,375 |
| Sudanese | 5.7 /100 | #217 | Tragic $58,281 |
| Panamanians | 5.6 /100 | #218 | Tragic $58,266 |
| Malaysians | 5.5 /100 | #219 | Tragic $58,244 |
| Yugoslavians | 5.5 /100 | #220 | Tragic $58,243 |
| Immigrants | El Salvador | 5.4 /100 | #221 | Tragic $58,226 |
| Delaware | 5.3 /100 | #222 | Tragic $58,214 |
| Tsimshian | 5.2 /100 | #223 | Tragic $58,202 |
| Bermudans | 5.1 /100 | #224 | Tragic $58,171 |
Demographics Similar to Indonesians by Householder Income Over 65 years
In terms of householder income over 65 years, the demographic groups most similar to Indonesians are Barbadian ($54,163, a difference of 0.020%), Potawatomi ($54,212, a difference of 0.070%), Cherokee ($54,133, a difference of 0.080%), Cree ($54,129, a difference of 0.090%), and Cheyenne ($54,096, a difference of 0.15%).
| Demographics | Rating | Rank | Householder Income Over 65 years |
| Jamaicans | 0.1 /100 | #266 | Tragic $54,560 |
| Guatemalans | 0.1 /100 | #267 | Tragic $54,526 |
| Immigrants | Zaire | 0.1 /100 | #268 | Tragic $54,512 |
| Nicaraguans | 0.1 /100 | #269 | Tragic $54,474 |
| Immigrants | Senegal | 0.1 /100 | #270 | Tragic $54,447 |
| Liberians | 0.1 /100 | #271 | Tragic $54,356 |
| Potawatomi | 0.1 /100 | #272 | Tragic $54,212 |
| Indonesians | 0.1 /100 | #273 | Tragic $54,176 |
| Barbadians | 0.1 /100 | #274 | Tragic $54,163 |
| Cherokee | 0.1 /100 | #275 | Tragic $54,133 |
| Cree | 0.1 /100 | #276 | Tragic $54,129 |
| Cheyenne | 0.1 /100 | #277 | Tragic $54,096 |
| Immigrants | Ecuador | 0.1 /100 | #278 | Tragic $54,030 |
| Blackfeet | 0.1 /100 | #279 | Tragic $54,029 |
| Immigrants | Jamaica | 0.1 /100 | #280 | Tragic $54,027 |