Taiwanese vs Immigrants from Grenada Median Family Income
COMPARE
Taiwanese
Immigrants from Grenada
Median Family Income
Median Family Income Comparison
Taiwanese
Immigrants from Grenada
$107,295
MEDIAN FAMILY INCOME
91.4/ 100
METRIC RATING
125th/ 347
METRIC RANK
$89,249
MEDIAN FAMILY INCOME
0.1/ 100
METRIC RATING
278th/ 347
METRIC RANK
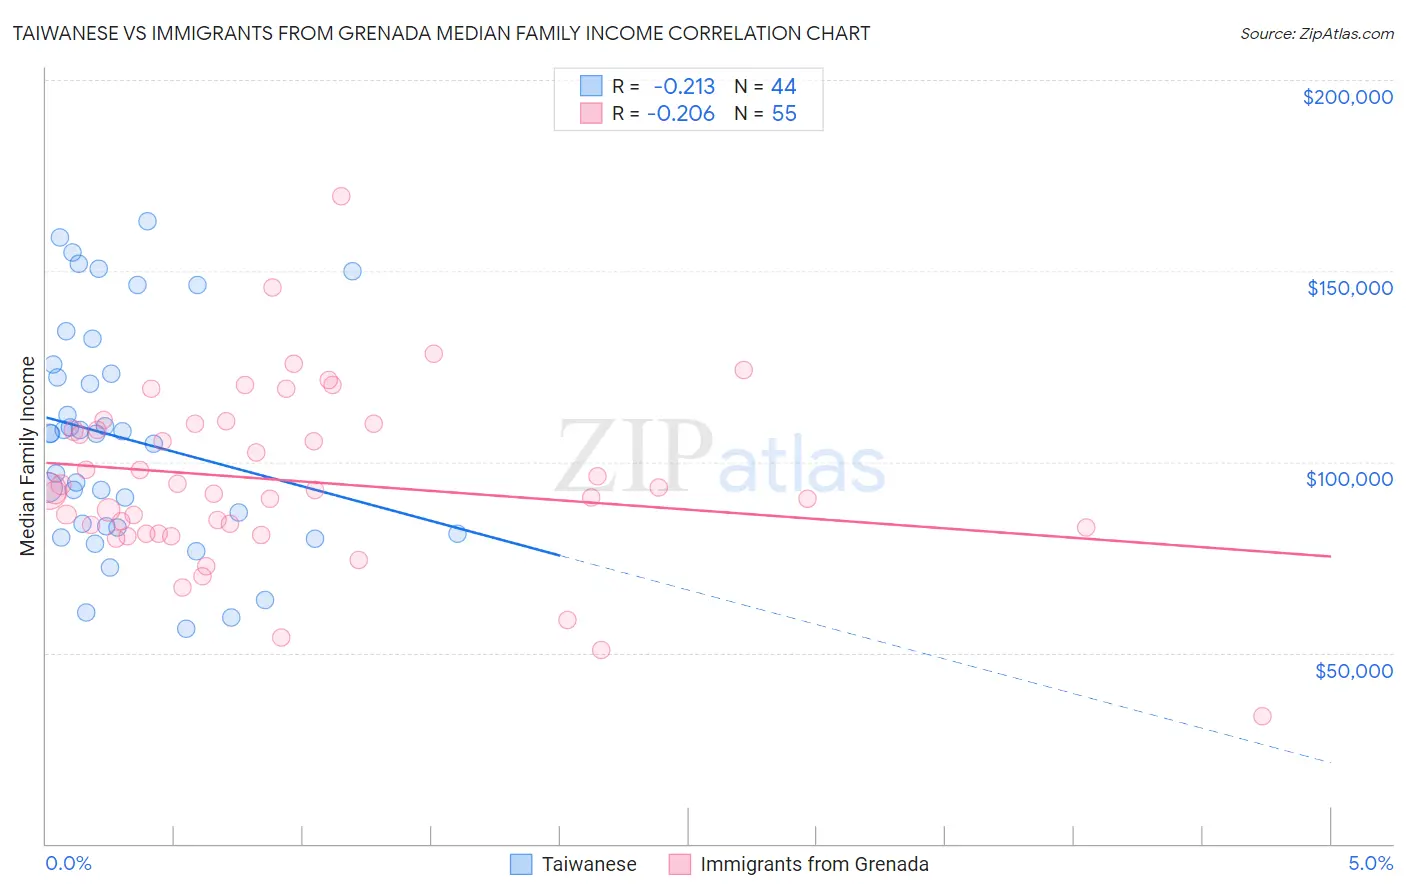
Taiwanese vs Immigrants from Grenada Median Family Income Correlation Chart
The statistical analysis conducted on geographies consisting of 31,709,765 people shows a weak negative correlation between the proportion of Taiwanese and median family income in the United States with a correlation coefficient (R) of -0.213 and weighted average of $107,295. Similarly, the statistical analysis conducted on geographies consisting of 67,181,093 people shows a weak negative correlation between the proportion of Immigrants from Grenada and median family income in the United States with a correlation coefficient (R) of -0.206 and weighted average of $89,249, a difference of 20.2%.
Median Family Income Correlation Summary
| Measurement | Taiwanese | Immigrants from Grenada |
| Minimum | $56,146 | $33,250 |
| Maximum | $162,974 | $169,583 |
| Range | $106,828 | $136,333 |
| Mean | $106,094 | $95,083 |
| Median | $107,372 | $92,174 |
| Interquartile 25% (IQ1) | $83,038 | $81,230 |
| Interquartile 75% (IQ3) | $124,300 | $109,949 |
| Interquartile Range (IQR) | $41,262 | $28,718 |
| Standard Deviation (Sample) | $29,129 | $23,232 |
| Standard Deviation (Population) | $28,796 | $23,020 |
Similar Demographics by Median Family Income
Demographics Similar to Taiwanese by Median Family Income
In terms of median family income, the demographic groups most similar to Taiwanese are Pakistani ($107,390, a difference of 0.090%), Serbian ($107,157, a difference of 0.13%), Carpatho Rusyn ($107,502, a difference of 0.19%), Lebanese ($107,086, a difference of 0.19%), and Immigrants from Ethiopia ($106,969, a difference of 0.30%).
| Demographics | Rating | Rank | Median Family Income |
| Ethiopians | 94.5 /100 | #118 | Exceptional $108,251 |
| Sri Lankans | 94.5 /100 | #119 | Exceptional $108,234 |
| Immigrants | Northern Africa | 94.3 /100 | #120 | Exceptional $108,161 |
| Europeans | 94.1 /100 | #121 | Exceptional $108,099 |
| Immigrants | Jordan | 92.9 /100 | #122 | Exceptional $107,715 |
| Carpatho Rusyns | 92.2 /100 | #123 | Exceptional $107,502 |
| Pakistanis | 91.7 /100 | #124 | Exceptional $107,390 |
| Taiwanese | 91.4 /100 | #125 | Exceptional $107,295 |
| Serbians | 90.8 /100 | #126 | Exceptional $107,157 |
| Lebanese | 90.5 /100 | #127 | Exceptional $107,086 |
| Immigrants | Ethiopia | 90.0 /100 | #128 | Excellent $106,969 |
| Arabs | 89.9 /100 | #129 | Excellent $106,952 |
| Brazilians | 89.8 /100 | #130 | Excellent $106,942 |
| Canadians | 88.1 /100 | #131 | Excellent $106,597 |
| Immigrants | Fiji | 87.8 /100 | #132 | Excellent $106,544 |
Demographics Similar to Immigrants from Grenada by Median Family Income
In terms of median family income, the demographic groups most similar to Immigrants from Grenada are Immigrants from Jamaica ($89,268, a difference of 0.020%), Immigrants from Zaire ($89,285, a difference of 0.040%), Immigrants from Belize ($89,197, a difference of 0.060%), British West Indian ($88,987, a difference of 0.29%), and Blackfeet ($88,717, a difference of 0.60%).
| Demographics | Rating | Rank | Median Family Income |
| Iroquois | 0.2 /100 | #271 | Tragic $90,543 |
| Immigrants | Liberia | 0.2 /100 | #272 | Tragic $90,450 |
| Immigrants | Micronesia | 0.2 /100 | #273 | Tragic $90,345 |
| Spanish Americans | 0.2 /100 | #274 | Tragic $90,322 |
| Immigrants | St. Vincent and the Grenadines | 0.2 /100 | #275 | Tragic $90,094 |
| Immigrants | Zaire | 0.1 /100 | #276 | Tragic $89,285 |
| Immigrants | Jamaica | 0.1 /100 | #277 | Tragic $89,268 |
| Immigrants | Grenada | 0.1 /100 | #278 | Tragic $89,249 |
| Immigrants | Belize | 0.1 /100 | #279 | Tragic $89,197 |
| British West Indians | 0.1 /100 | #280 | Tragic $88,987 |
| Blackfeet | 0.1 /100 | #281 | Tragic $88,717 |
| Comanche | 0.1 /100 | #282 | Tragic $88,556 |
| Bangladeshis | 0.1 /100 | #283 | Tragic $88,358 |
| Indonesians | 0.1 /100 | #284 | Tragic $88,301 |
| Guatemalans | 0.1 /100 | #285 | Tragic $88,295 |