Taiwanese vs Korean Median Male Earnings
COMPARE
Taiwanese
Korean
Median Male Earnings
Median Male Earnings Comparison
Taiwanese
Koreans
$55,556
MEDIAN MALE EARNINGS
73.9/ 100
METRIC RATING
154th/ 347
METRIC RANK
$56,672
MEDIAN MALE EARNINGS
89.4/ 100
METRIC RATING
130th/ 347
METRIC RANK
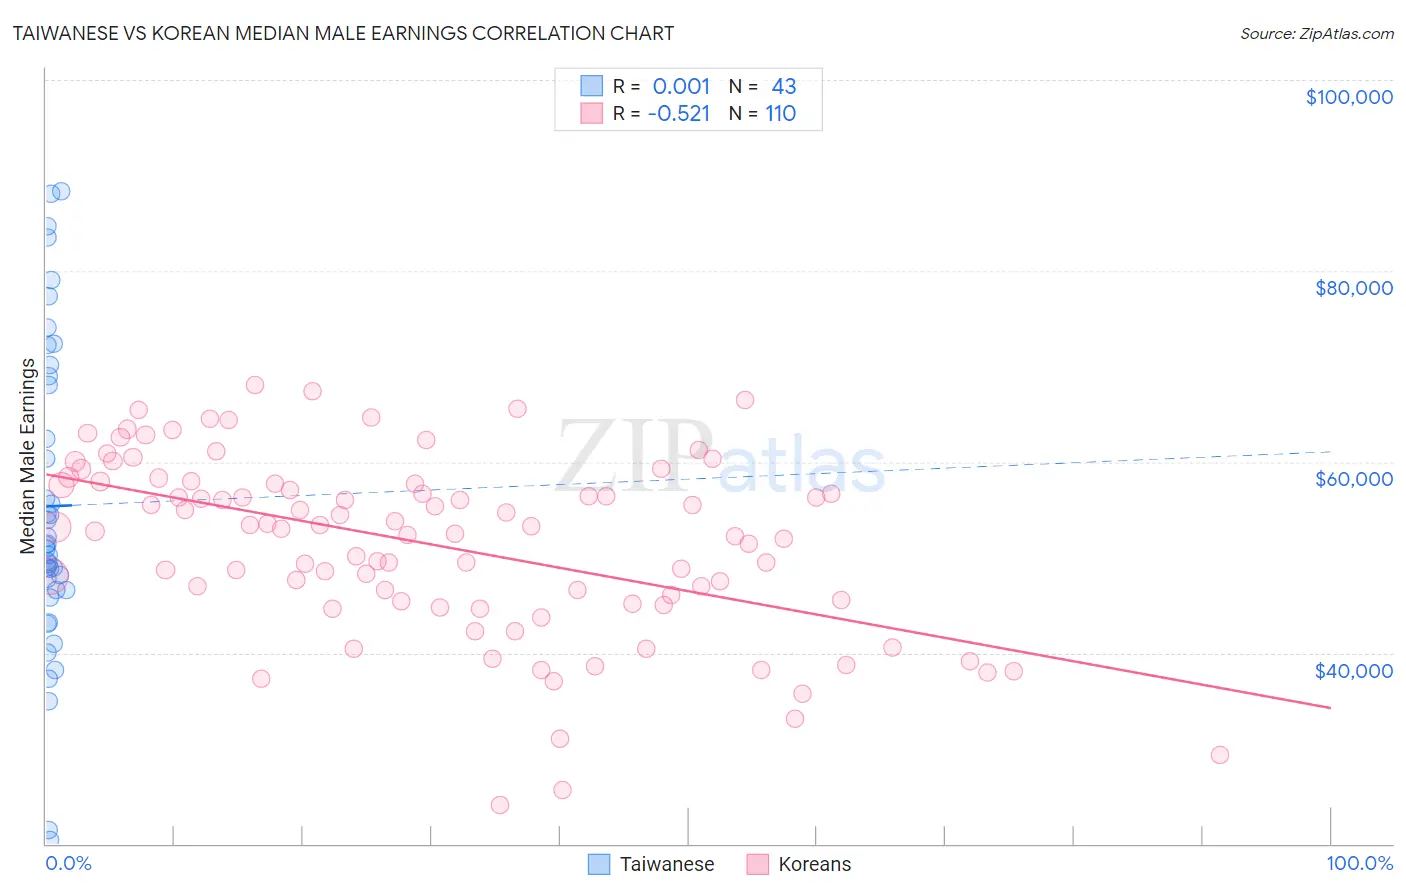
Taiwanese vs Korean Median Male Earnings Correlation Chart
The statistical analysis conducted on geographies consisting of 31,719,634 people shows no correlation between the proportion of Taiwanese and median male earnings in the United States with a correlation coefficient (R) of 0.001 and weighted average of $55,556. Similarly, the statistical analysis conducted on geographies consisting of 510,664,628 people shows a substantial negative correlation between the proportion of Koreans and median male earnings in the United States with a correlation coefficient (R) of -0.521 and weighted average of $56,672, a difference of 2.0%.
Median Male Earnings Correlation Summary
| Measurement | Taiwanese | Korean |
| Minimum | $20,367 | $24,028 |
| Maximum | $88,333 | $67,994 |
| Range | $67,966 | $43,966 |
| Mean | $55,357 | $51,299 |
| Median | $51,283 | $53,093 |
| Interquartile 25% (IQ1) | $46,547 | $45,357 |
| Interquartile 75% (IQ3) | $68,930 | $57,742 |
| Interquartile Range (IQR) | $22,384 | $12,385 |
| Standard Deviation (Sample) | $16,341 | $9,399 |
| Standard Deviation (Population) | $16,149 | $9,356 |
Similar Demographics by Median Male Earnings
Demographics Similar to Taiwanese by Median Male Earnings
In terms of median male earnings, the demographic groups most similar to Taiwanese are Scandinavian ($55,527, a difference of 0.050%), Immigrants from Nepal ($55,615, a difference of 0.11%), Peruvian ($55,659, a difference of 0.19%), Immigrants from Ethiopia ($55,434, a difference of 0.22%), and Icelander ($55,415, a difference of 0.25%).
| Demographics | Rating | Rank | Median Male Earnings |
| Immigrants | Philippines | 78.4 /100 | #147 | Good $55,809 |
| Scottish | 78.2 /100 | #148 | Good $55,793 |
| English | 77.4 /100 | #149 | Good $55,747 |
| Swiss | 77.1 /100 | #150 | Good $55,731 |
| Immigrants | Oceania | 76.8 /100 | #151 | Good $55,712 |
| Peruvians | 75.8 /100 | #152 | Good $55,659 |
| Immigrants | Nepal | 75.0 /100 | #153 | Good $55,615 |
| Taiwanese | 73.9 /100 | #154 | Good $55,556 |
| Scandinavians | 73.4 /100 | #155 | Good $55,527 |
| Immigrants | Ethiopia | 71.6 /100 | #156 | Good $55,434 |
| Icelanders | 71.2 /100 | #157 | Good $55,415 |
| Czechoslovakians | 70.5 /100 | #158 | Good $55,382 |
| Alsatians | 70.5 /100 | #159 | Good $55,380 |
| Basques | 70.3 /100 | #160 | Good $55,370 |
| Belgians | 70.1 /100 | #161 | Good $55,361 |
Demographics Similar to Koreans by Median Male Earnings
In terms of median male earnings, the demographic groups most similar to Koreans are Portuguese ($56,663, a difference of 0.020%), Pakistani ($56,719, a difference of 0.080%), Czech ($56,546, a difference of 0.22%), Immigrants from Germany ($56,542, a difference of 0.23%), and Immigrants from Syria ($56,830, a difference of 0.28%).
| Demographics | Rating | Rank | Median Male Earnings |
| Slovenes | 93.1 /100 | #123 | Exceptional $57,145 |
| Chileans | 91.9 /100 | #124 | Exceptional $56,973 |
| Immigrants | Morocco | 91.8 /100 | #125 | Exceptional $56,958 |
| Chinese | 91.1 /100 | #126 | Exceptional $56,872 |
| Brazilians | 90.9 /100 | #127 | Exceptional $56,837 |
| Immigrants | Syria | 90.8 /100 | #128 | Exceptional $56,830 |
| Pakistanis | 89.9 /100 | #129 | Excellent $56,719 |
| Koreans | 89.4 /100 | #130 | Excellent $56,672 |
| Portuguese | 89.4 /100 | #131 | Excellent $56,663 |
| Czechs | 88.2 /100 | #132 | Excellent $56,546 |
| Immigrants | Germany | 88.2 /100 | #133 | Excellent $56,542 |
| Moroccans | 87.7 /100 | #134 | Excellent $56,499 |
| Irish | 87.4 /100 | #135 | Excellent $56,464 |
| Immigrants | Saudi Arabia | 87.2 /100 | #136 | Excellent $56,452 |
| Slavs | 86.5 /100 | #137 | Excellent $56,390 |