Thai vs Immigrants Wage/Income Gap
COMPARE
Thai
Immigrants
Wage/Income Gap
Wage/Income Gap Comparison
Thais
Immigrants
30.5%
WAGE/INCOME GAP
0.0/ 100
METRIC RATING
341st/ 347
METRIC RANK
25.1%
WAGE/INCOME GAP
82.3/ 100
METRIC RATING
150th/ 347
METRIC RANK
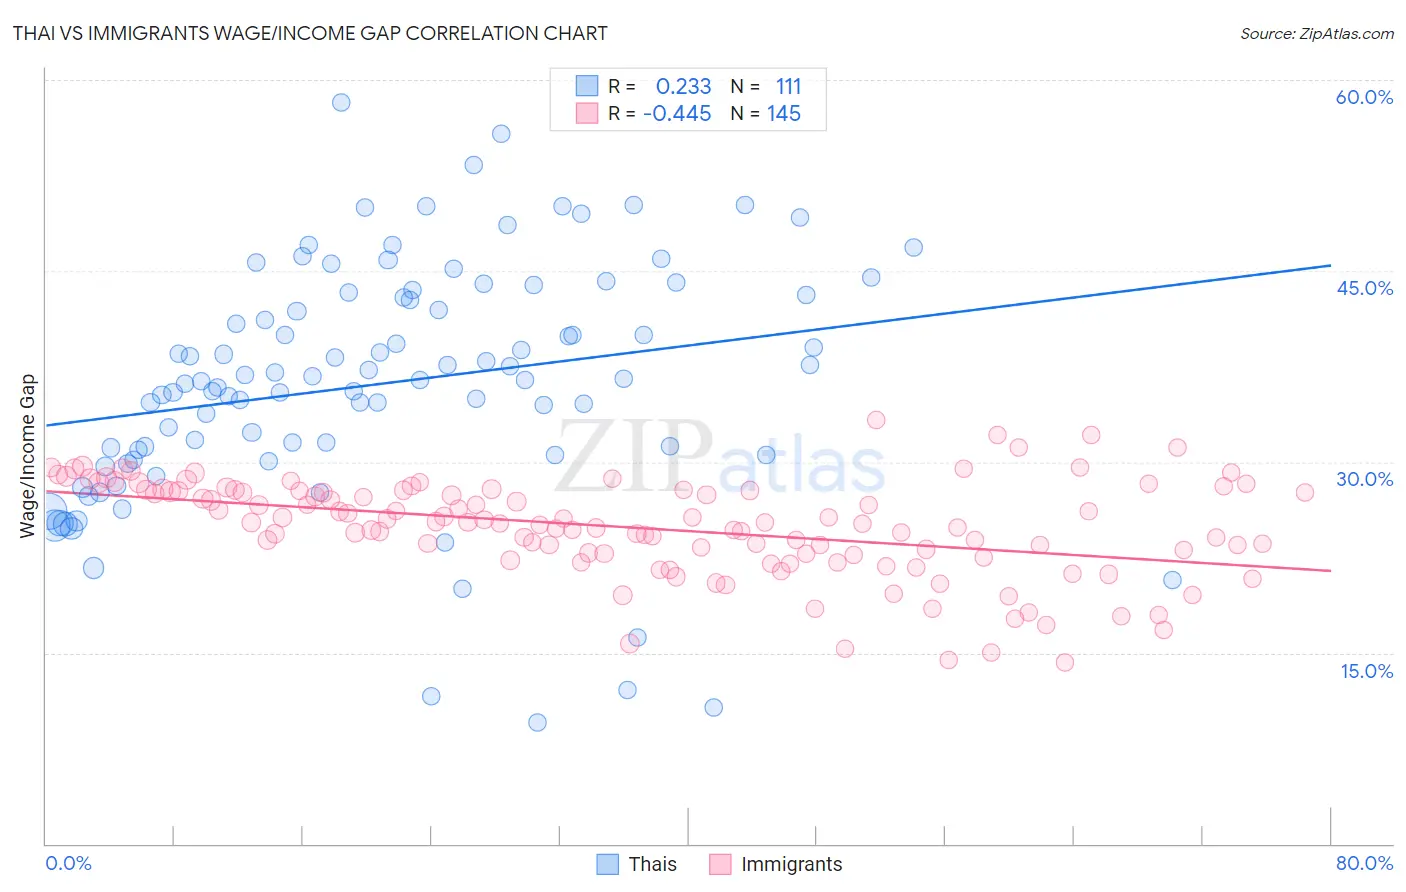
Thai vs Immigrants Wage/Income Gap Correlation Chart
The statistical analysis conducted on geographies consisting of 475,429,891 people shows a weak positive correlation between the proportion of Thais and wage/income gap percentage in the United States with a correlation coefficient (R) of 0.233 and weighted average of 30.5%. Similarly, the statistical analysis conducted on geographies consisting of 574,033,804 people shows a moderate negative correlation between the proportion of Immigrants and wage/income gap percentage in the United States with a correlation coefficient (R) of -0.445 and weighted average of 25.1%, a difference of 21.2%.
Wage/Income Gap Correlation Summary
| Measurement | Thai | Immigrants |
| Minimum | 9.5% | 14.2% |
| Maximum | 58.3% | 33.3% |
| Range | 48.7% | 19.1% |
| Mean | 36.2% | 24.8% |
| Median | 36.4% | 25.2% |
| Interquartile 25% (IQ1) | 30.5% | 22.8% |
| Interquartile 75% (IQ3) | 43.1% | 27.7% |
| Interquartile Range (IQR) | 12.6% | 5.0% |
| Standard Deviation (Sample) | 9.4% | 3.8% |
| Standard Deviation (Population) | 9.4% | 3.8% |
Similar Demographics by Wage/Income Gap
Demographics Similar to Thais by Wage/Income Gap
In terms of wage/income gap, the demographic groups most similar to Thais are Pennsylvania German (30.7%, a difference of 0.77%), Danish (31.0%, a difference of 1.6%), Swiss (30.0%, a difference of 1.7%), Assyrian/Chaldean/Syriac (31.0%, a difference of 1.8%), and Iranian (29.7%, a difference of 2.5%).
| Demographics | Rating | Rank | Wage/Income Gap |
| Europeans | 0.0 /100 | #333 | Tragic 29.4% |
| Swedes | 0.0 /100 | #334 | Tragic 29.4% |
| Immigrants | Taiwan | 0.0 /100 | #335 | Tragic 29.5% |
| English | 0.0 /100 | #336 | Tragic 29.5% |
| Dutch | 0.0 /100 | #337 | Tragic 29.6% |
| Filipinos | 0.0 /100 | #338 | Tragic 29.7% |
| Iranians | 0.0 /100 | #339 | Tragic 29.7% |
| Swiss | 0.0 /100 | #340 | Tragic 30.0% |
| Thais | 0.0 /100 | #341 | Tragic 30.5% |
| Pennsylvania Germans | 0.0 /100 | #342 | Tragic 30.7% |
| Danes | 0.0 /100 | #343 | Tragic 31.0% |
| Assyrians/Chaldeans/Syriacs | 0.0 /100 | #344 | Tragic 31.0% |
| Immigrants | India | 0.0 /100 | #345 | Tragic 31.5% |
| Cajuns | 0.0 /100 | #346 | Tragic 33.9% |
| Houma | 0.0 /100 | #347 | Tragic 38.7% |
Demographics Similar to Immigrants by Wage/Income Gap
In terms of wage/income gap, the demographic groups most similar to Immigrants are Immigrants from Peru (25.1%, a difference of 0.040%), Taiwanese (25.1%, a difference of 0.080%), Uruguayan (25.2%, a difference of 0.11%), Iroquois (25.1%, a difference of 0.19%), and Malaysian (25.0%, a difference of 0.33%).
| Demographics | Rating | Rank | Wage/Income Gap |
| Immigrants | Uganda | 88.0 /100 | #143 | Excellent 24.9% |
| Chippewa | 86.9 /100 | #144 | Excellent 25.0% |
| Comanche | 85.2 /100 | #145 | Excellent 25.0% |
| South Americans | 85.2 /100 | #146 | Excellent 25.0% |
| Malaysians | 84.9 /100 | #147 | Excellent 25.0% |
| Iroquois | 83.9 /100 | #148 | Excellent 25.1% |
| Immigrants | Peru | 82.6 /100 | #149 | Excellent 25.1% |
| Immigrants | Immigrants | 82.3 /100 | #150 | Excellent 25.1% |
| Taiwanese | 81.6 /100 | #151 | Excellent 25.1% |
| Uruguayans | 81.3 /100 | #152 | Excellent 25.2% |
| Blackfeet | 78.1 /100 | #153 | Good 25.2% |
| Immigrants | Northern Africa | 78.1 /100 | #154 | Good 25.2% |
| Immigrants | Vietnam | 77.7 /100 | #155 | Good 25.2% |
| Immigrants | Mexico | 76.4 /100 | #156 | Good 25.3% |
| Costa Ricans | 75.8 /100 | #157 | Good 25.3% |