Tlingit-Haida vs Samoan Householder Income Ages 45 - 64 years
COMPARE
Tlingit-Haida
Samoan
Householder Income Ages 45 - 64 years
Householder Income Ages 45 - 64 years Comparison
Tlingit-Haida
Samoans
$97,417
HOUSEHOLDER INCOME AGES 45 - 64 YEARS
18.9/ 100
METRIC RATING
202nd/ 347
METRIC RANK
$101,580
HOUSEHOLDER INCOME AGES 45 - 64 YEARS
65.3/ 100
METRIC RATING
166th/ 347
METRIC RANK
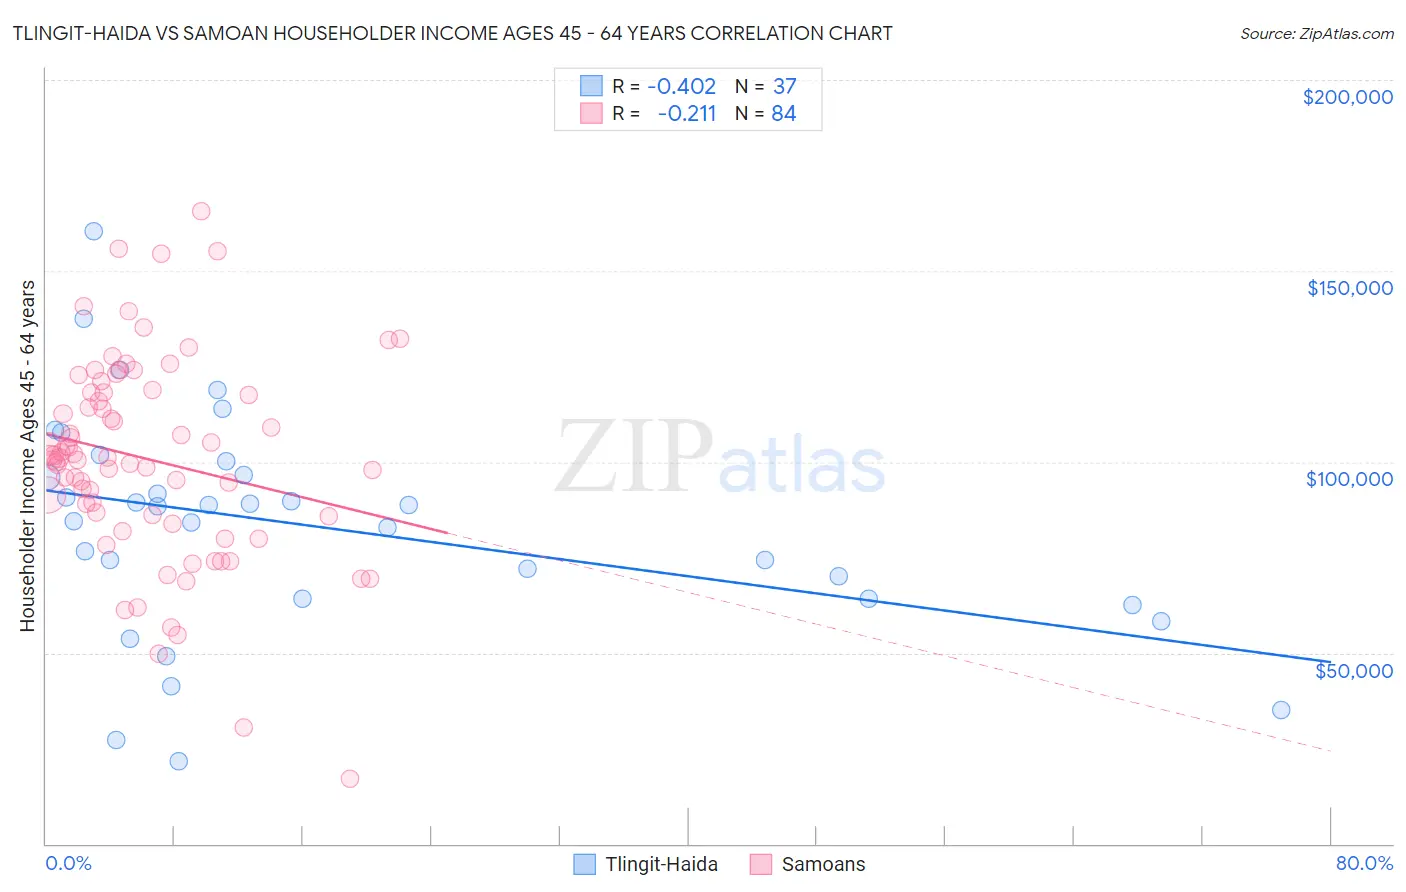
Tlingit-Haida vs Samoan Householder Income Ages 45 - 64 years Correlation Chart
The statistical analysis conducted on geographies consisting of 60,826,750 people shows a moderate negative correlation between the proportion of Tlingit-Haida and household income with householder between the ages 45 and 64 in the United States with a correlation coefficient (R) of -0.402 and weighted average of $97,417. Similarly, the statistical analysis conducted on geographies consisting of 224,959,731 people shows a weak negative correlation between the proportion of Samoans and household income with householder between the ages 45 and 64 in the United States with a correlation coefficient (R) of -0.211 and weighted average of $101,580, a difference of 4.3%.
Householder Income Ages 45 - 64 years Correlation Summary
| Measurement | Tlingit-Haida | Samoan |
| Minimum | $21,563 | $16,995 |
| Maximum | $160,485 | $165,714 |
| Range | $138,922 | $148,719 |
| Mean | $83,137 | $100,718 |
| Median | $88,264 | $101,006 |
| Interquartile 25% (IQ1) | $64,077 | $85,977 |
| Interquartile 75% (IQ3) | $98,405 | $118,111 |
| Interquartile Range (IQR) | $34,328 | $32,135 |
| Standard Deviation (Sample) | $29,197 | $26,759 |
| Standard Deviation (Population) | $28,800 | $26,599 |
Similar Demographics by Householder Income Ages 45 - 64 years
Demographics Similar to Tlingit-Haida by Householder Income Ages 45 - 64 years
In terms of householder income ages 45 - 64 years, the demographic groups most similar to Tlingit-Haida are Immigrants from Thailand ($97,400, a difference of 0.020%), Immigrants from Eritrea ($97,373, a difference of 0.040%), Immigrants from Colombia ($97,290, a difference of 0.13%), Immigrants from Africa ($97,284, a difference of 0.14%), and Ghanaian ($97,277, a difference of 0.14%).
| Demographics | Rating | Rank | Householder Income Ages 45 - 64 years |
| Spanish | 29.2 /100 | #195 | Fair $98,554 |
| Immigrants | Eastern Africa | 28.3 /100 | #196 | Fair $98,467 |
| Puget Sound Salish | 27.0 /100 | #197 | Fair $98,340 |
| Immigrants | Iraq | 25.7 /100 | #198 | Fair $98,201 |
| Whites/Caucasians | 24.6 /100 | #199 | Fair $98,091 |
| Immigrants | Kenya | 23.5 /100 | #200 | Fair $97,964 |
| Yugoslavians | 20.0 /100 | #201 | Fair $97,558 |
| Tlingit-Haida | 18.9 /100 | #202 | Poor $97,417 |
| Immigrants | Thailand | 18.8 /100 | #203 | Poor $97,400 |
| Immigrants | Eritrea | 18.6 /100 | #204 | Poor $97,373 |
| Immigrants | Colombia | 18.0 /100 | #205 | Poor $97,290 |
| Immigrants | Africa | 17.9 /100 | #206 | Poor $97,284 |
| Ghanaians | 17.9 /100 | #207 | Poor $97,277 |
| Scotch-Irish | 16.4 /100 | #208 | Poor $97,073 |
| Japanese | 14.8 /100 | #209 | Poor $96,834 |
Demographics Similar to Samoans by Householder Income Ages 45 - 64 years
In terms of householder income ages 45 - 64 years, the demographic groups most similar to Samoans are Czechoslovakian ($101,387, a difference of 0.19%), Immigrants from Albania ($101,957, a difference of 0.37%), South American Indian ($101,171, a difference of 0.40%), Guamanian/Chamorro ($101,170, a difference of 0.41%), and English ($102,021, a difference of 0.43%).
| Demographics | Rating | Rank | Householder Income Ages 45 - 64 years |
| Sierra Leoneans | 74.2 /100 | #159 | Good $102,427 |
| Icelanders | 72.5 /100 | #160 | Good $102,261 |
| Immigrants | Nepal | 71.8 /100 | #161 | Good $102,190 |
| Scottish | 71.1 /100 | #162 | Good $102,123 |
| English | 70.1 /100 | #163 | Good $102,021 |
| Immigrants | Morocco | 70.0 /100 | #164 | Good $102,015 |
| Immigrants | Albania | 69.4 /100 | #165 | Good $101,957 |
| Samoans | 65.3 /100 | #166 | Good $101,580 |
| Czechoslovakians | 63.0 /100 | #167 | Good $101,387 |
| South American Indians | 60.5 /100 | #168 | Good $101,171 |
| Guamanians/Chamorros | 60.5 /100 | #169 | Good $101,170 |
| Slovaks | 58.8 /100 | #170 | Average $101,029 |
| South Americans | 56.4 /100 | #171 | Average $100,837 |
| Immigrants | Uzbekistan | 52.5 /100 | #172 | Average $100,523 |
| Alsatians | 51.4 /100 | #173 | Average $100,435 |