Tongan vs Tsimshian Per Capita Income
COMPARE
Tongan
Tsimshian
Per Capita Income
Per Capita Income Comparison
Tongans
Tsimshian
$41,693
PER CAPITA INCOME
9.9/ 100
METRIC RATING
216th/ 347
METRIC RANK
$40,344
PER CAPITA INCOME
2.4/ 100
METRIC RATING
239th/ 347
METRIC RANK
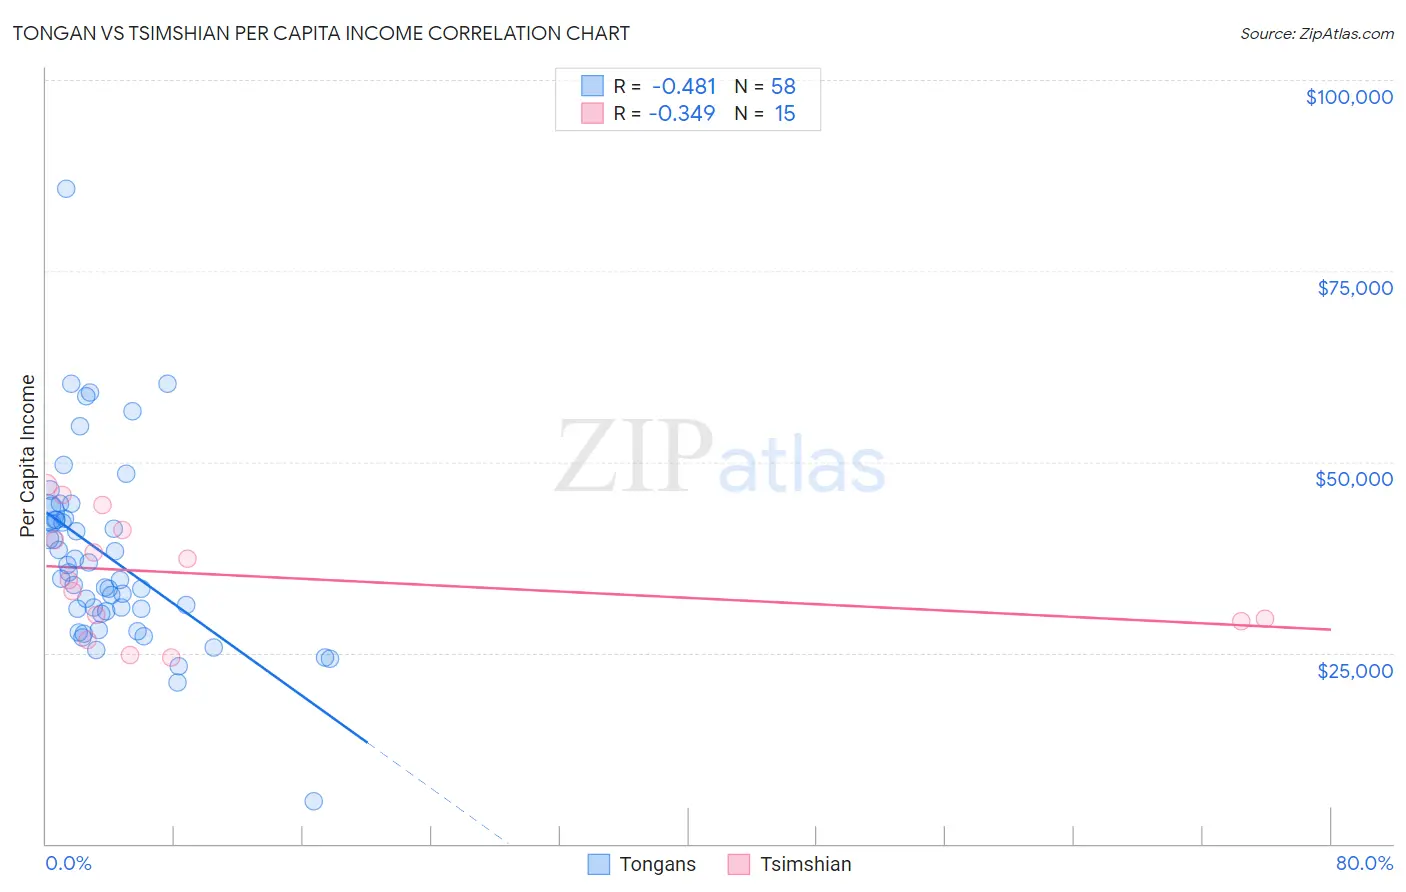
Tongan vs Tsimshian Per Capita Income Correlation Chart
The statistical analysis conducted on geographies consisting of 102,908,385 people shows a moderate negative correlation between the proportion of Tongans and per capita income in the United States with a correlation coefficient (R) of -0.481 and weighted average of $41,693. Similarly, the statistical analysis conducted on geographies consisting of 15,626,544 people shows a mild negative correlation between the proportion of Tsimshian and per capita income in the United States with a correlation coefficient (R) of -0.349 and weighted average of $40,344, a difference of 3.3%.
Per Capita Income Correlation Summary
| Measurement | Tongan | Tsimshian |
| Minimum | $5,622 | $24,381 |
| Maximum | $85,704 | $46,938 |
| Range | $80,082 | $22,557 |
| Mean | $37,644 | $35,015 |
| Median | $35,100 | $34,603 |
| Interquartile 25% (IQ1) | $30,397 | $29,100 |
| Interquartile 75% (IQ3) | $42,507 | $41,057 |
| Interquartile Range (IQR) | $12,110 | $11,957 |
| Standard Deviation (Sample) | $12,429 | $7,569 |
| Standard Deviation (Population) | $12,321 | $7,313 |
Similar Demographics by Per Capita Income
Demographics Similar to Tongans by Per Capita Income
In terms of per capita income, the demographic groups most similar to Tongans are Sudanese ($41,695, a difference of 0.010%), Guamanian/Chamorro ($41,678, a difference of 0.030%), Immigrants from Bangladesh ($41,709, a difference of 0.040%), Immigrants from Venezuela ($41,727, a difference of 0.080%), and Trinidadian and Tobagonian ($41,655, a difference of 0.090%).
| Demographics | Rating | Rank | Per Capita Income |
| Immigrants | Sudan | 13.2 /100 | #209 | Poor $41,986 |
| Ecuadorians | 12.9 /100 | #210 | Poor $41,958 |
| Immigrants | Panama | 11.6 /100 | #211 | Poor $41,853 |
| Immigrants | Senegal | 11.3 /100 | #212 | Poor $41,830 |
| Immigrants | Venezuela | 10.2 /100 | #213 | Poor $41,727 |
| Immigrants | Bangladesh | 10.1 /100 | #214 | Poor $41,709 |
| Sudanese | 9.9 /100 | #215 | Tragic $41,695 |
| Tongans | 9.9 /100 | #216 | Tragic $41,693 |
| Guamanians/Chamorros | 9.7 /100 | #217 | Tragic $41,678 |
| Trinidadians and Tobagonians | 9.5 /100 | #218 | Tragic $41,655 |
| Puget Sound Salish | 8.1 /100 | #219 | Tragic $41,495 |
| Immigrants | Barbados | 7.9 /100 | #220 | Tragic $41,478 |
| Immigrants | Trinidad and Tobago | 7.9 /100 | #221 | Tragic $41,476 |
| Immigrants | Iraq | 7.1 /100 | #222 | Tragic $41,365 |
| Immigrants | Cameroon | 6.8 /100 | #223 | Tragic $41,334 |
Demographics Similar to Tsimshian by Per Capita Income
In terms of per capita income, the demographic groups most similar to Tsimshian are Immigrants from Nigeria ($40,339, a difference of 0.010%), British West Indian ($40,330, a difference of 0.040%), Somali ($40,367, a difference of 0.060%), Immigrants from Western Africa ($40,294, a difference of 0.12%), and German Russian ($40,266, a difference of 0.19%).
| Demographics | Rating | Rank | Per Capita Income |
| Guyanese | 4.5 /100 | #232 | Tragic $40,949 |
| Delaware | 3.8 /100 | #233 | Tragic $40,778 |
| Immigrants | West Indies | 3.7 /100 | #234 | Tragic $40,763 |
| Immigrants | Guyana | 3.6 /100 | #235 | Tragic $40,742 |
| Immigrants | Nonimmigrants | 3.4 /100 | #236 | Tragic $40,669 |
| Immigrants | Cambodia | 2.6 /100 | #237 | Tragic $40,434 |
| Somalis | 2.4 /100 | #238 | Tragic $40,367 |
| Tsimshian | 2.4 /100 | #239 | Tragic $40,344 |
| Immigrants | Nigeria | 2.3 /100 | #240 | Tragic $40,339 |
| British West Indians | 2.3 /100 | #241 | Tragic $40,330 |
| Immigrants | Western Africa | 2.2 /100 | #242 | Tragic $40,294 |
| German Russians | 2.2 /100 | #243 | Tragic $40,266 |
| French American Indians | 2.1 /100 | #244 | Tragic $40,244 |
| Sub-Saharan Africans | 1.9 /100 | #245 | Tragic $40,152 |
| Cree | 1.7 /100 | #246 | Tragic $40,056 |