Tsimshian vs Immigrants from Nicaragua Median Household Income
COMPARE
Tsimshian
Immigrants from Nicaragua
Median Household Income
Median Household Income Comparison
Tsimshian
Immigrants from Nicaragua
$83,346
MEDIAN HOUSEHOLD INCOME
24.5/ 100
METRIC RATING
200th/ 347
METRIC RANK
$76,784
MEDIAN HOUSEHOLD INCOME
0.5/ 100
METRIC RATING
258th/ 347
METRIC RANK
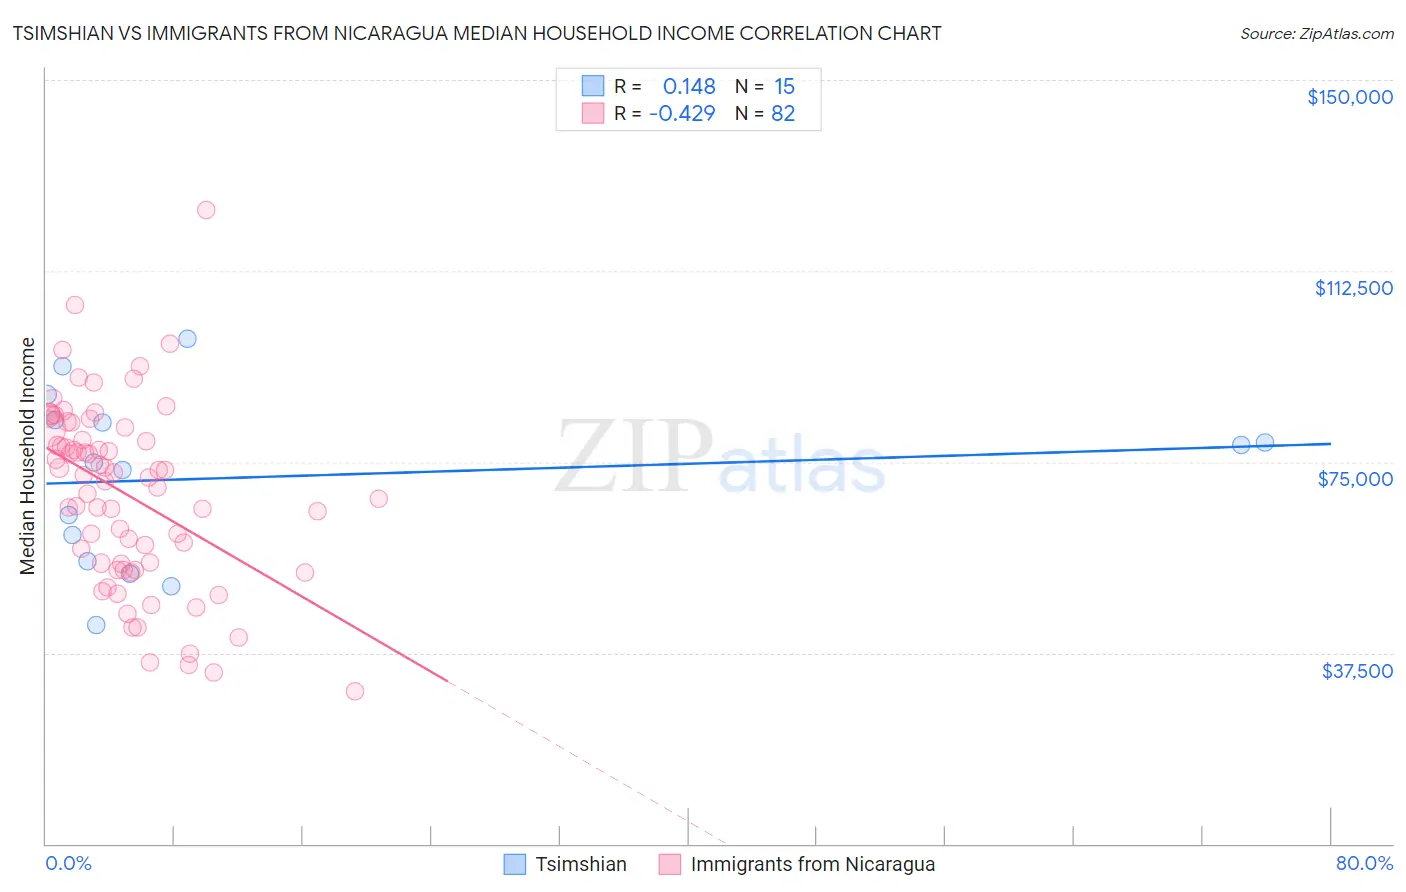
Tsimshian vs Immigrants from Nicaragua Median Household Income Correlation Chart
The statistical analysis conducted on geographies consisting of 15,626,462 people shows a poor positive correlation between the proportion of Tsimshian and median household income in the United States with a correlation coefficient (R) of 0.148 and weighted average of $83,346. Similarly, the statistical analysis conducted on geographies consisting of 236,313,434 people shows a moderate negative correlation between the proportion of Immigrants from Nicaragua and median household income in the United States with a correlation coefficient (R) of -0.429 and weighted average of $76,784, a difference of 8.6%.
Median Household Income Correlation Summary
| Measurement | Tsimshian | Immigrants from Nicaragua |
| Minimum | $42,857 | $29,878 |
| Maximum | $99,167 | $124,491 |
| Range | $56,310 | $94,613 |
| Mean | $71,994 | $68,743 |
| Median | $75,000 | $72,189 |
| Interquartile 25% (IQ1) | $55,448 | $54,917 |
| Interquartile 75% (IQ3) | $83,217 | $81,583 |
| Interquartile Range (IQR) | $27,769 | $26,666 |
| Standard Deviation (Sample) | $16,777 | $17,913 |
| Standard Deviation (Population) | $16,208 | $17,803 |
Similar Demographics by Median Household Income
Demographics Similar to Tsimshian by Median Household Income
In terms of median household income, the demographic groups most similar to Tsimshian are Spanish ($83,343, a difference of 0.0%), German ($83,358, a difference of 0.010%), Immigrants from Thailand ($83,327, a difference of 0.020%), Immigrants from Cambodia ($83,304, a difference of 0.050%), and Japanese ($83,395, a difference of 0.060%).
| Demographics | Rating | Rank | Median Household Income |
| Finns | 27.7 /100 | #193 | Fair $83,607 |
| Ghanaians | 27.4 /100 | #194 | Fair $83,582 |
| Immigrants | Armenia | 27.0 /100 | #195 | Fair $83,555 |
| French | 26.0 /100 | #196 | Fair $83,468 |
| Aleuts | 25.7 /100 | #197 | Fair $83,446 |
| Japanese | 25.1 /100 | #198 | Fair $83,395 |
| Germans | 24.6 /100 | #199 | Fair $83,358 |
| Tsimshian | 24.5 /100 | #200 | Fair $83,346 |
| Spanish | 24.4 /100 | #201 | Fair $83,343 |
| Immigrants | Thailand | 24.3 /100 | #202 | Fair $83,327 |
| Immigrants | Cambodia | 24.0 /100 | #203 | Fair $83,304 |
| Immigrants | Africa | 23.8 /100 | #204 | Fair $83,289 |
| Celtics | 22.7 /100 | #205 | Fair $83,193 |
| Immigrants | Kenya | 21.3 /100 | #206 | Fair $83,068 |
| Dutch | 20.3 /100 | #207 | Fair $82,971 |
Demographics Similar to Immigrants from Nicaragua by Median Household Income
In terms of median household income, the demographic groups most similar to Immigrants from Nicaragua are Spanish American Indian ($76,670, a difference of 0.15%), Immigrants from Senegal ($76,915, a difference of 0.17%), Jamaican ($76,583, a difference of 0.26%), Belizean ($77,028, a difference of 0.32%), and Immigrants from Grenada ($76,517, a difference of 0.35%).
| Demographics | Rating | Rank | Median Household Income |
| Mexican American Indians | 1.2 /100 | #251 | Tragic $78,166 |
| Immigrants | West Indies | 1.0 /100 | #252 | Tragic $77,956 |
| Immigrants | St. Vincent and the Grenadines | 0.9 /100 | #253 | Tragic $77,690 |
| Sub-Saharan Africans | 0.8 /100 | #254 | Tragic $77,631 |
| Immigrants | Middle Africa | 0.8 /100 | #255 | Tragic $77,559 |
| Belizeans | 0.6 /100 | #256 | Tragic $77,028 |
| Immigrants | Senegal | 0.5 /100 | #257 | Tragic $76,915 |
| Immigrants | Nicaragua | 0.5 /100 | #258 | Tragic $76,784 |
| Spanish American Indians | 0.4 /100 | #259 | Tragic $76,670 |
| Jamaicans | 0.4 /100 | #260 | Tragic $76,583 |
| Immigrants | Grenada | 0.4 /100 | #261 | Tragic $76,517 |
| French American Indians | 0.4 /100 | #262 | Tragic $76,387 |
| Alaskan Athabascans | 0.4 /100 | #263 | Tragic $76,383 |
| Guatemalans | 0.3 /100 | #264 | Tragic $75,961 |
| Immigrants | Belize | 0.3 /100 | #265 | Tragic $75,938 |