Ukrainian vs Dominican Median Household Income
COMPARE
Ukrainian
Dominican
Median Household Income
Median Household Income Comparison
Ukrainians
Dominicans
$91,456
MEDIAN HOUSEHOLD INCOME
98.3/ 100
METRIC RATING
100th/ 347
METRIC RANK
$71,302
MEDIAN HOUSEHOLD INCOME
0.0/ 100
METRIC RATING
314th/ 347
METRIC RANK
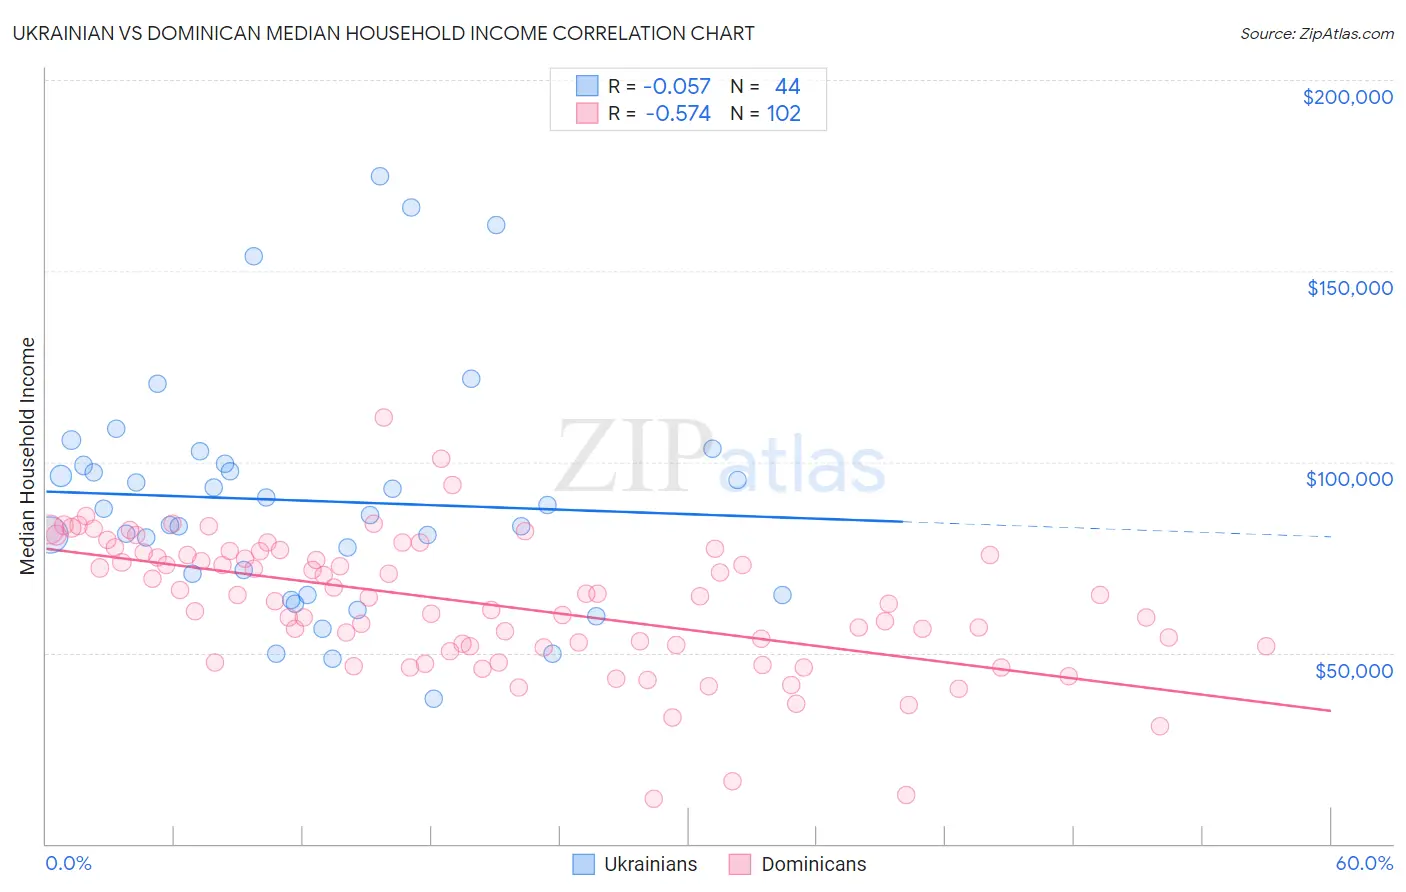
Ukrainian vs Dominican Median Household Income Correlation Chart
The statistical analysis conducted on geographies consisting of 448,198,646 people shows a slight negative correlation between the proportion of Ukrainians and median household income in the United States with a correlation coefficient (R) of -0.057 and weighted average of $91,456. Similarly, the statistical analysis conducted on geographies consisting of 354,675,302 people shows a substantial negative correlation between the proportion of Dominicans and median household income in the United States with a correlation coefficient (R) of -0.574 and weighted average of $71,302, a difference of 28.3%.
Median Household Income Correlation Summary
| Measurement | Ukrainian | Dominican |
| Minimum | $37,811 | $11,801 |
| Maximum | $174,670 | $111,701 |
| Range | $136,859 | $99,900 |
| Mean | $89,793 | $62,844 |
| Median | $86,791 | $64,590 |
| Interquartile 25% (IQ1) | $67,812 | $51,574 |
| Interquartile 75% (IQ3) | $99,299 | $76,260 |
| Interquartile Range (IQR) | $31,486 | $24,686 |
| Standard Deviation (Sample) | $30,572 | $17,716 |
| Standard Deviation (Population) | $30,223 | $17,629 |
Similar Demographics by Median Household Income
Demographics Similar to Ukrainians by Median Household Income
In terms of median household income, the demographic groups most similar to Ukrainians are Immigrants from Moldova ($91,446, a difference of 0.010%), Immigrants from South Eastern Asia ($91,541, a difference of 0.090%), Austrian ($91,339, a difference of 0.13%), Immigrants from Southern Europe ($91,605, a difference of 0.16%), and Immigrants from Serbia ($91,730, a difference of 0.30%).
| Demographics | Rating | Rank | Median Household Income |
| Immigrants | Lebanon | 98.7 /100 | #93 | Exceptional $91,887 |
| Immigrants | North America | 98.7 /100 | #94 | Exceptional $91,860 |
| Armenians | 98.7 /100 | #95 | Exceptional $91,807 |
| Jordanians | 98.7 /100 | #96 | Exceptional $91,794 |
| Immigrants | Serbia | 98.6 /100 | #97 | Exceptional $91,730 |
| Immigrants | Southern Europe | 98.5 /100 | #98 | Exceptional $91,605 |
| Immigrants | South Eastern Asia | 98.4 /100 | #99 | Exceptional $91,541 |
| Ukrainians | 98.3 /100 | #100 | Exceptional $91,456 |
| Immigrants | Moldova | 98.3 /100 | #101 | Exceptional $91,446 |
| Austrians | 98.2 /100 | #102 | Exceptional $91,339 |
| Immigrants | Ukraine | 98.0 /100 | #103 | Exceptional $91,124 |
| Immigrants | Kazakhstan | 97.8 /100 | #104 | Exceptional $91,015 |
| Immigrants | Brazil | 97.7 /100 | #105 | Exceptional $90,907 |
| Macedonians | 97.4 /100 | #106 | Exceptional $90,761 |
| Croatians | 97.3 /100 | #107 | Exceptional $90,685 |
Demographics Similar to Dominicans by Median Household Income
In terms of median household income, the demographic groups most similar to Dominicans are Immigrants from Bahamas ($71,349, a difference of 0.060%), Immigrants from Honduras ($71,452, a difference of 0.21%), Ottawa ($70,984, a difference of 0.45%), Apache ($70,927, a difference of 0.53%), and Immigrants from Zaire ($71,801, a difference of 0.70%).
| Demographics | Rating | Rank | Median Household Income |
| Ute | 0.0 /100 | #307 | Tragic $72,402 |
| Yakama | 0.0 /100 | #308 | Tragic $72,225 |
| Immigrants | Caribbean | 0.0 /100 | #309 | Tragic $71,860 |
| U.S. Virgin Islanders | 0.0 /100 | #310 | Tragic $71,853 |
| Immigrants | Zaire | 0.0 /100 | #311 | Tragic $71,801 |
| Immigrants | Honduras | 0.0 /100 | #312 | Tragic $71,452 |
| Immigrants | Bahamas | 0.0 /100 | #313 | Tragic $71,349 |
| Dominicans | 0.0 /100 | #314 | Tragic $71,302 |
| Ottawa | 0.0 /100 | #315 | Tragic $70,984 |
| Apache | 0.0 /100 | #316 | Tragic $70,927 |
| Cajuns | 0.0 /100 | #317 | Tragic $70,605 |
| Chippewa | 0.0 /100 | #318 | Tragic $70,539 |
| Immigrants | Dominican Republic | 0.0 /100 | #319 | Tragic $70,208 |
| Colville | 0.0 /100 | #320 | Tragic $70,094 |
| Chickasaw | 0.0 /100 | #321 | Tragic $70,005 |