Vietnamese vs Irish Median Male Earnings
COMPARE
Vietnamese
Irish
Median Male Earnings
Median Male Earnings Comparison
Vietnamese
Irish
$52,525
MEDIAN MALE EARNINGS
12.7/ 100
METRIC RATING
207th/ 347
METRIC RANK
$56,464
MEDIAN MALE EARNINGS
87.4/ 100
METRIC RATING
135th/ 347
METRIC RANK
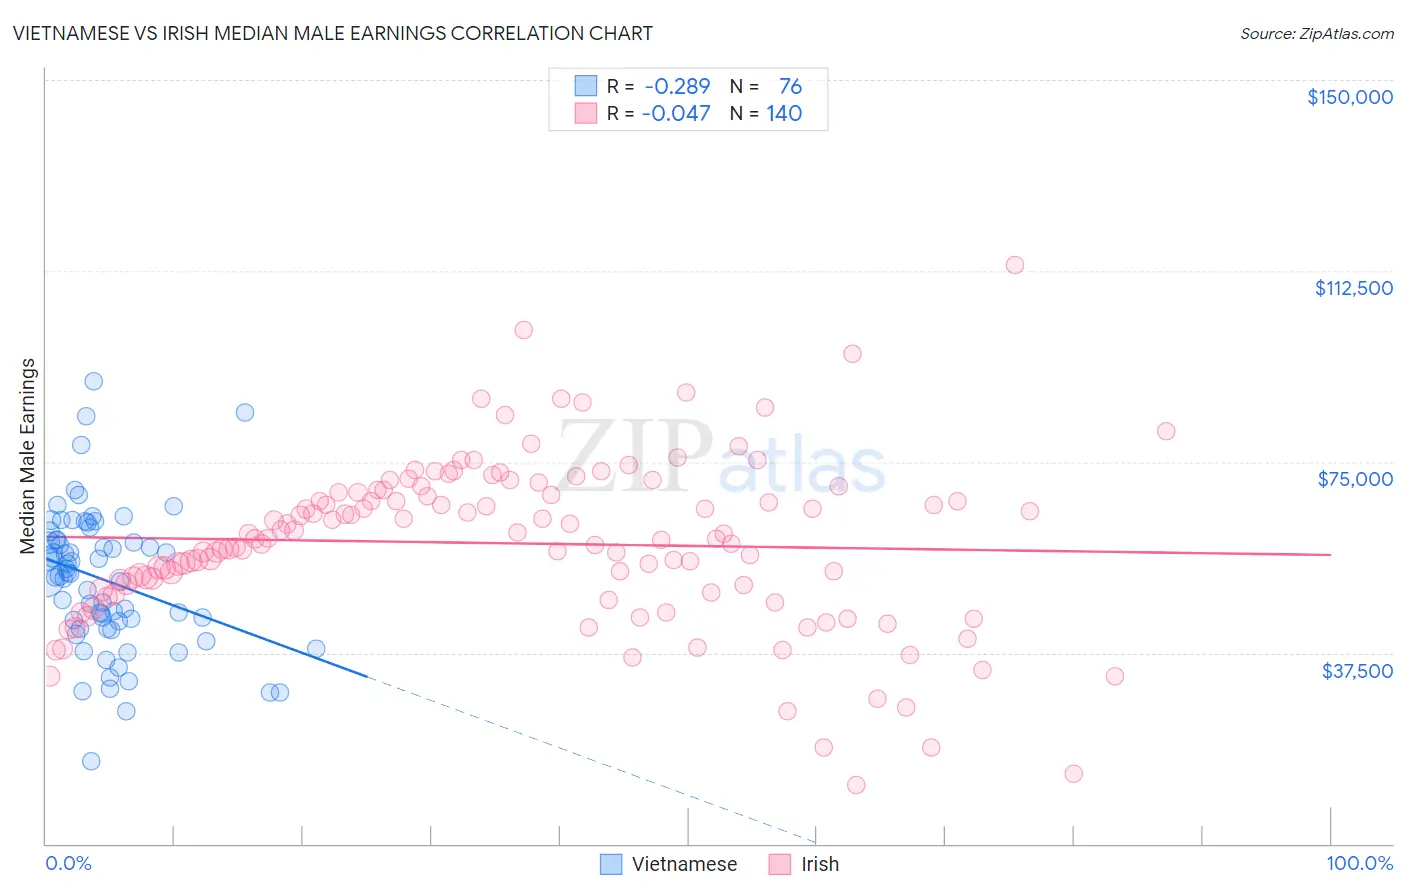
Vietnamese vs Irish Median Male Earnings Correlation Chart
The statistical analysis conducted on geographies consisting of 170,734,633 people shows a weak negative correlation between the proportion of Vietnamese and median male earnings in the United States with a correlation coefficient (R) of -0.289 and weighted average of $52,525. Similarly, the statistical analysis conducted on geographies consisting of 578,544,263 people shows no correlation between the proportion of Irish and median male earnings in the United States with a correlation coefficient (R) of -0.047 and weighted average of $56,464, a difference of 7.5%.
Median Male Earnings Correlation Summary
| Measurement | Vietnamese | Irish |
| Minimum | $16,146 | $11,458 |
| Maximum | $90,827 | $113,788 |
| Range | $74,681 | $102,330 |
| Mean | $51,791 | $59,014 |
| Median | $52,846 | $59,889 |
| Interquartile 25% (IQ1) | $43,003 | $49,565 |
| Interquartile 75% (IQ3) | $59,635 | $68,949 |
| Interquartile Range (IQR) | $16,633 | $19,384 |
| Standard Deviation (Sample) | $13,801 | $16,409 |
| Standard Deviation (Population) | $13,710 | $16,350 |
Similar Demographics by Median Male Earnings
Demographics Similar to Vietnamese by Median Male Earnings
In terms of median male earnings, the demographic groups most similar to Vietnamese are Venezuelan ($52,510, a difference of 0.030%), Bermudan ($52,465, a difference of 0.11%), Delaware ($52,412, a difference of 0.22%), Tlingit-Haida ($52,409, a difference of 0.22%), and Immigrants from Iraq ($52,681, a difference of 0.30%).
| Demographics | Rating | Rank | Median Male Earnings |
| Immigrants | Thailand | 17.5 /100 | #200 | Poor $52,908 |
| Immigrants | Bosnia and Herzegovina | 16.9 /100 | #201 | Poor $52,869 |
| Immigrants | Uruguay | 16.8 /100 | #202 | Poor $52,860 |
| Panamanians | 16.5 /100 | #203 | Poor $52,835 |
| Ghanaians | 16.1 /100 | #204 | Poor $52,810 |
| Immigrants | Colombia | 15.0 /100 | #205 | Poor $52,725 |
| Immigrants | Iraq | 14.5 /100 | #206 | Poor $52,681 |
| Vietnamese | 12.7 /100 | #207 | Poor $52,525 |
| Venezuelans | 12.5 /100 | #208 | Poor $52,510 |
| Bermudans | 12.1 /100 | #209 | Poor $52,465 |
| Delaware | 11.5 /100 | #210 | Poor $52,412 |
| Tlingit-Haida | 11.5 /100 | #211 | Poor $52,409 |
| Cajuns | 10.7 /100 | #212 | Poor $52,325 |
| Native Hawaiians | 10.5 /100 | #213 | Poor $52,306 |
| Immigrants | Nonimmigrants | 9.3 /100 | #214 | Tragic $52,170 |
Demographics Similar to Irish by Median Male Earnings
In terms of median male earnings, the demographic groups most similar to Irish are Immigrants from Saudi Arabia ($56,452, a difference of 0.020%), Moroccan ($56,499, a difference of 0.060%), Slavic ($56,390, a difference of 0.13%), Czech ($56,546, a difference of 0.14%), and Immigrants from Germany ($56,542, a difference of 0.14%).
| Demographics | Rating | Rank | Median Male Earnings |
| Immigrants | Syria | 90.8 /100 | #128 | Exceptional $56,830 |
| Pakistanis | 89.9 /100 | #129 | Excellent $56,719 |
| Koreans | 89.4 /100 | #130 | Excellent $56,672 |
| Portuguese | 89.4 /100 | #131 | Excellent $56,663 |
| Czechs | 88.2 /100 | #132 | Excellent $56,546 |
| Immigrants | Germany | 88.2 /100 | #133 | Excellent $56,542 |
| Moroccans | 87.7 /100 | #134 | Excellent $56,499 |
| Irish | 87.4 /100 | #135 | Excellent $56,464 |
| Immigrants | Saudi Arabia | 87.2 /100 | #136 | Excellent $56,452 |
| Slavs | 86.5 /100 | #137 | Excellent $56,390 |
| Slovaks | 85.5 /100 | #138 | Excellent $56,306 |
| Zimbabweans | 85.5 /100 | #139 | Excellent $56,302 |
| Luxembourgers | 85.5 /100 | #140 | Excellent $56,300 |
| Danes | 84.8 /100 | #141 | Excellent $56,246 |
| Ethiopians | 84.8 /100 | #142 | Excellent $56,243 |