Yuman vs Immigrants from Cabo Verde Median Female Earnings
COMPARE
Yuman
Immigrants from Cabo Verde
Median Female Earnings
Median Female Earnings Comparison
Yuman
Immigrants from Cabo Verde
$35,377
MEDIAN FEMALE EARNINGS
0.0/ 100
METRIC RATING
300th/ 347
METRIC RANK
$38,208
MEDIAN FEMALE EARNINGS
4.3/ 100
METRIC RATING
237th/ 347
METRIC RANK
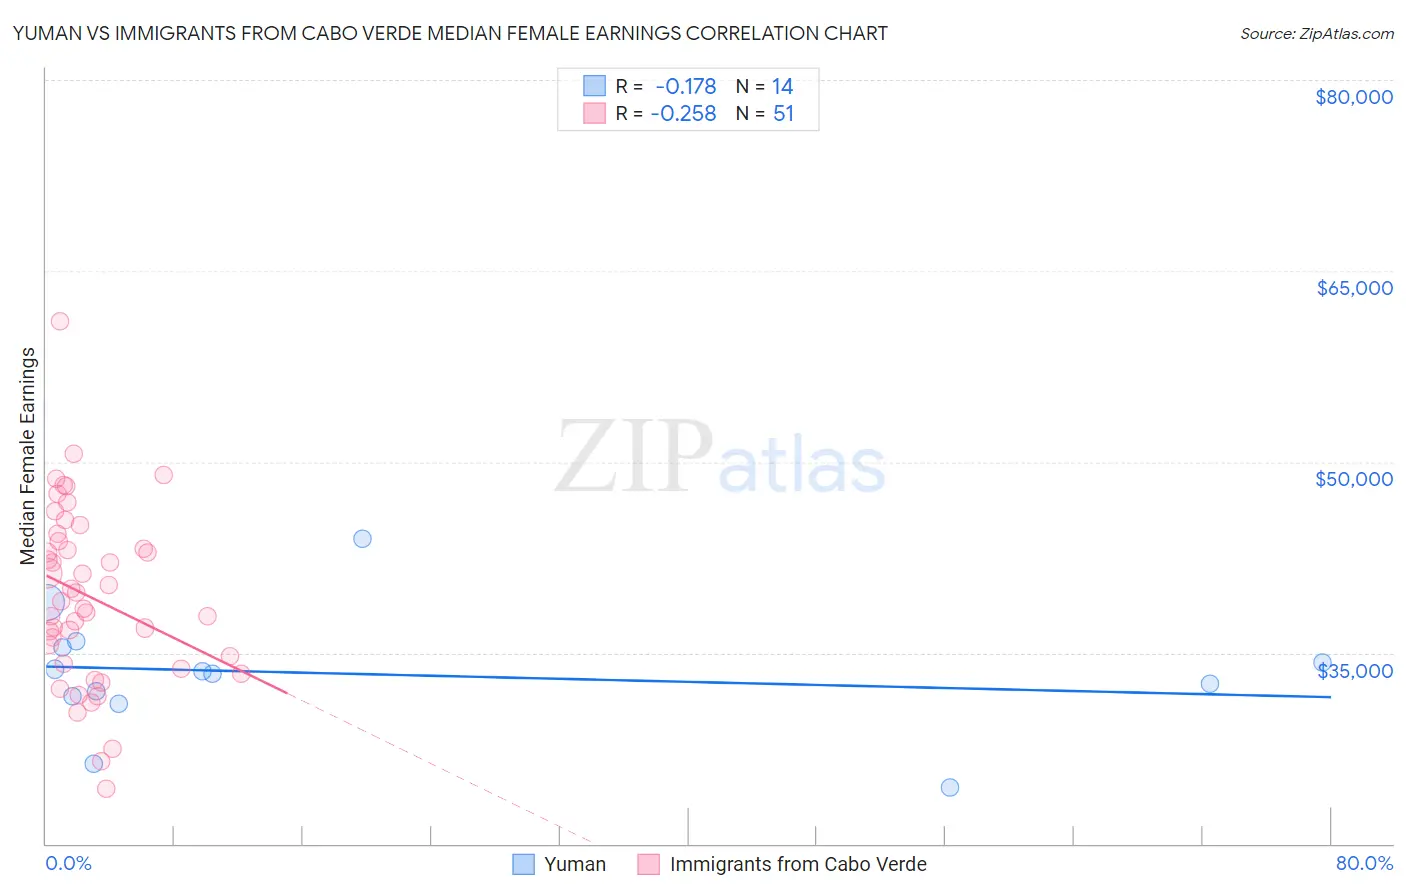
Yuman vs Immigrants from Cabo Verde Median Female Earnings Correlation Chart
The statistical analysis conducted on geographies consisting of 40,678,701 people shows a poor negative correlation between the proportion of Yuman and median female earnings in the United States with a correlation coefficient (R) of -0.178 and weighted average of $35,377. Similarly, the statistical analysis conducted on geographies consisting of 38,158,316 people shows a weak negative correlation between the proportion of Immigrants from Cabo Verde and median female earnings in the United States with a correlation coefficient (R) of -0.258 and weighted average of $38,208, a difference of 8.0%.
Median Female Earnings Correlation Summary
| Measurement | Yuman | Immigrants from Cabo Verde |
| Minimum | $24,415 | $24,340 |
| Maximum | $43,952 | $61,096 |
| Range | $19,537 | $36,756 |
| Mean | $33,355 | $39,427 |
| Median | $33,435 | $39,071 |
| Interquartile 25% (IQ1) | $31,604 | $34,187 |
| Interquartile 75% (IQ3) | $35,454 | $43,779 |
| Interquartile Range (IQR) | $3,850 | $9,592 |
| Standard Deviation (Sample) | $4,771 | $6,953 |
| Standard Deviation (Population) | $4,598 | $6,885 |
Similar Demographics by Median Female Earnings
Demographics Similar to Yuman by Median Female Earnings
In terms of median female earnings, the demographic groups most similar to Yuman are Pima ($35,326, a difference of 0.14%), Black/African American ($35,315, a difference of 0.18%), Immigrants from Guatemala ($35,444, a difference of 0.19%), Immigrants from Latin America ($35,307, a difference of 0.20%), and Immigrants from Micronesia ($35,477, a difference of 0.28%).
| Demographics | Rating | Rank | Median Female Earnings |
| Guatemalans | 0.0 /100 | #293 | Tragic $35,695 |
| Cheyenne | 0.0 /100 | #294 | Tragic $35,673 |
| Comanche | 0.0 /100 | #295 | Tragic $35,661 |
| Mexican American Indians | 0.0 /100 | #296 | Tragic $35,629 |
| Hmong | 0.0 /100 | #297 | Tragic $35,498 |
| Immigrants | Micronesia | 0.0 /100 | #298 | Tragic $35,477 |
| Immigrants | Guatemala | 0.0 /100 | #299 | Tragic $35,444 |
| Yuman | 0.0 /100 | #300 | Tragic $35,377 |
| Pima | 0.0 /100 | #301 | Tragic $35,326 |
| Blacks/African Americans | 0.0 /100 | #302 | Tragic $35,315 |
| Immigrants | Latin America | 0.0 /100 | #303 | Tragic $35,307 |
| Crow | 0.0 /100 | #304 | Tragic $35,266 |
| Bahamians | 0.0 /100 | #305 | Tragic $35,125 |
| Fijians | 0.0 /100 | #306 | Tragic $35,114 |
| Sioux | 0.0 /100 | #307 | Tragic $35,063 |
Demographics Similar to Immigrants from Cabo Verde by Median Female Earnings
In terms of median female earnings, the demographic groups most similar to Immigrants from Cabo Verde are Sudanese ($38,215, a difference of 0.020%), Liberian ($38,215, a difference of 0.020%), Alaska Native ($38,202, a difference of 0.020%), English ($38,196, a difference of 0.030%), and Finnish ($38,173, a difference of 0.090%).
| Demographics | Rating | Rank | Median Female Earnings |
| Basques | 5.7 /100 | #230 | Tragic $38,352 |
| Somalis | 5.5 /100 | #231 | Tragic $38,333 |
| Scandinavians | 5.2 /100 | #232 | Tragic $38,306 |
| Tongans | 5.1 /100 | #233 | Tragic $38,288 |
| Celtics | 5.0 /100 | #234 | Tragic $38,283 |
| Sudanese | 4.4 /100 | #235 | Tragic $38,215 |
| Liberians | 4.4 /100 | #236 | Tragic $38,215 |
| Immigrants | Cabo Verde | 4.3 /100 | #237 | Tragic $38,208 |
| Alaska Natives | 4.3 /100 | #238 | Tragic $38,202 |
| English | 4.2 /100 | #239 | Tragic $38,196 |
| Finns | 4.0 /100 | #240 | Tragic $38,173 |
| Spanish | 3.5 /100 | #241 | Tragic $38,098 |
| Immigrants | Burma/Myanmar | 3.0 /100 | #242 | Tragic $38,028 |
| Germans | 2.8 /100 | #243 | Tragic $37,986 |
| Immigrants | Liberia | 2.7 /100 | #244 | Tragic $37,970 |