Yup'ik vs Comanche Householder Income Ages 45 - 64 years
COMPARE
Yup'ik
Comanche
Householder Income Ages 45 - 64 years
Householder Income Ages 45 - 64 years Comparison
Yup'ik
Comanche
$81,000
HOUSEHOLDER INCOME AGES 45 - 64 YEARS
0.0/ 100
METRIC RATING
324th/ 347
METRIC RANK
$85,787
HOUSEHOLDER INCOME AGES 45 - 64 YEARS
0.1/ 100
METRIC RATING
293rd/ 347
METRIC RANK
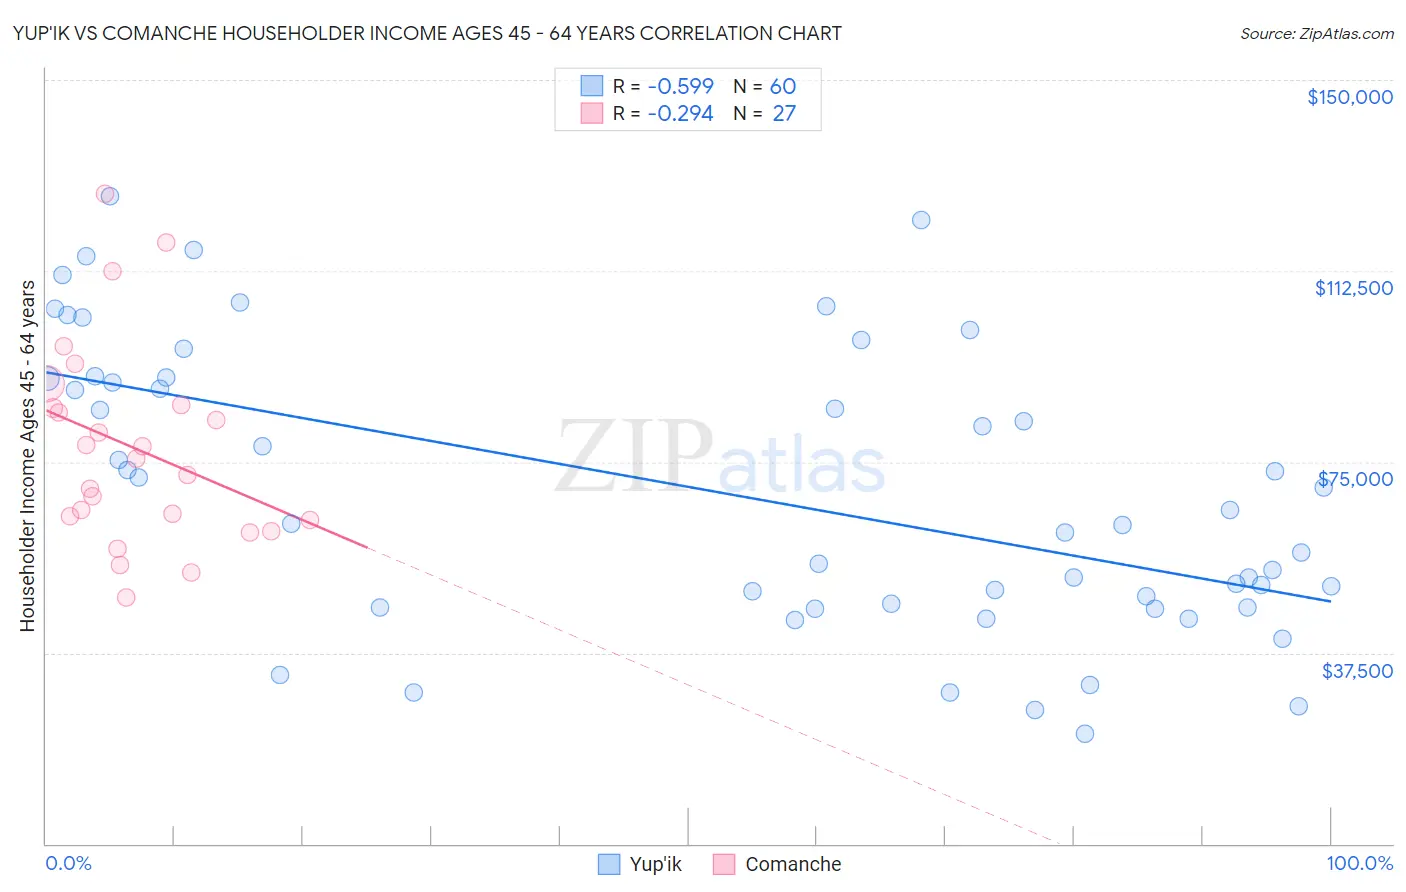
Yup'ik vs Comanche Householder Income Ages 45 - 64 years Correlation Chart
The statistical analysis conducted on geographies consisting of 39,943,055 people shows a substantial negative correlation between the proportion of Yup'ik and household income with householder between the ages 45 and 64 in the United States with a correlation coefficient (R) of -0.599 and weighted average of $81,000. Similarly, the statistical analysis conducted on geographies consisting of 109,696,818 people shows a weak negative correlation between the proportion of Comanche and household income with householder between the ages 45 and 64 in the United States with a correlation coefficient (R) of -0.294 and weighted average of $85,787, a difference of 5.9%.
Householder Income Ages 45 - 64 years Correlation Summary
| Measurement | Yup'ik | Comanche |
| Minimum | $21,563 | $48,474 |
| Maximum | $127,108 | $127,559 |
| Range | $105,545 | $79,085 |
| Mean | $69,372 | $77,729 |
| Median | $64,271 | $75,610 |
| Interquartile 25% (IQ1) | $46,840 | $63,523 |
| Interquartile 75% (IQ3) | $91,495 | $86,210 |
| Interquartile Range (IQR) | $44,656 | $22,687 |
| Standard Deviation (Sample) | $27,859 | $19,770 |
| Standard Deviation (Population) | $27,626 | $19,400 |
Similar Demographics by Householder Income Ages 45 - 64 years
Demographics Similar to Yup'ik by Householder Income Ages 45 - 64 years
In terms of householder income ages 45 - 64 years, the demographic groups most similar to Yup'ik are Immigrants from Cuba ($80,662, a difference of 0.42%), Bahamian ($81,369, a difference of 0.46%), Dominican ($80,623, a difference of 0.47%), Sioux ($81,750, a difference of 0.93%), and Seminole ($80,077, a difference of 1.1%).
| Demographics | Rating | Rank | Householder Income Ages 45 - 64 years |
| Colville | 0.0 /100 | #317 | Tragic $82,474 |
| Choctaw | 0.0 /100 | #318 | Tragic $82,287 |
| Chickasaw | 0.0 /100 | #319 | Tragic $82,193 |
| Apache | 0.0 /100 | #320 | Tragic $82,184 |
| Yuman | 0.0 /100 | #321 | Tragic $82,139 |
| Sioux | 0.0 /100 | #322 | Tragic $81,750 |
| Bahamians | 0.0 /100 | #323 | Tragic $81,369 |
| Yup'ik | 0.0 /100 | #324 | Tragic $81,000 |
| Immigrants | Cuba | 0.0 /100 | #325 | Tragic $80,662 |
| Dominicans | 0.0 /100 | #326 | Tragic $80,623 |
| Seminole | 0.0 /100 | #327 | Tragic $80,077 |
| Natives/Alaskans | 0.0 /100 | #328 | Tragic $79,816 |
| Dutch West Indians | 0.0 /100 | #329 | Tragic $79,171 |
| Creek | 0.0 /100 | #330 | Tragic $78,960 |
| Immigrants | Dominican Republic | 0.0 /100 | #331 | Tragic $78,836 |
Demographics Similar to Comanche by Householder Income Ages 45 - 64 years
In terms of householder income ages 45 - 64 years, the demographic groups most similar to Comanche are Immigrants from Central America ($85,965, a difference of 0.21%), Hispanic or Latino ($86,006, a difference of 0.25%), British West Indian ($85,571, a difference of 0.25%), Immigrants from Grenada ($85,552, a difference of 0.27%), and Cherokee ($86,125, a difference of 0.39%).
| Demographics | Rating | Rank | Householder Income Ages 45 - 64 years |
| Immigrants | Guatemala | 0.1 /100 | #286 | Tragic $86,573 |
| Bangladeshis | 0.1 /100 | #287 | Tragic $86,402 |
| Immigrants | St. Vincent and the Grenadines | 0.1 /100 | #288 | Tragic $86,394 |
| Cubans | 0.1 /100 | #289 | Tragic $86,301 |
| Cherokee | 0.1 /100 | #290 | Tragic $86,125 |
| Hispanics or Latinos | 0.1 /100 | #291 | Tragic $86,006 |
| Immigrants | Central America | 0.1 /100 | #292 | Tragic $85,965 |
| Comanche | 0.1 /100 | #293 | Tragic $85,787 |
| British West Indians | 0.1 /100 | #294 | Tragic $85,571 |
| Immigrants | Grenada | 0.1 /100 | #295 | Tragic $85,552 |
| Immigrants | Zaire | 0.1 /100 | #296 | Tragic $85,207 |
| Fijians | 0.1 /100 | #297 | Tragic $85,187 |
| Africans | 0.0 /100 | #298 | Tragic $84,925 |
| Immigrants | Mexico | 0.0 /100 | #299 | Tragic $84,910 |
| Indonesians | 0.0 /100 | #300 | Tragic $84,890 |