Haitian Wage/Income Gap
COMPARE
Haitian
Select to Compare
Wage/Income Gap
Haitian Wage/Income Gap
19.7%
WAGE/INCOME GAP
100.0/ 100
METRIC RATING
17th/ 347
METRIC RANK
Haitian Wage/Income Gap Correlation Chart
The statistical analysis conducted on geographies consisting of 287,832,408 people shows a slight negative correlation between the proportion of Haitians and wage/income gap percentage in the United States with a correlation coefficient (R) of -0.099 and weighted average of 19.7%. On average, for every 1% (one percent) increase in Haitians within a typical geography, there is a decrease of 0.068% in wage/income gap percentage.
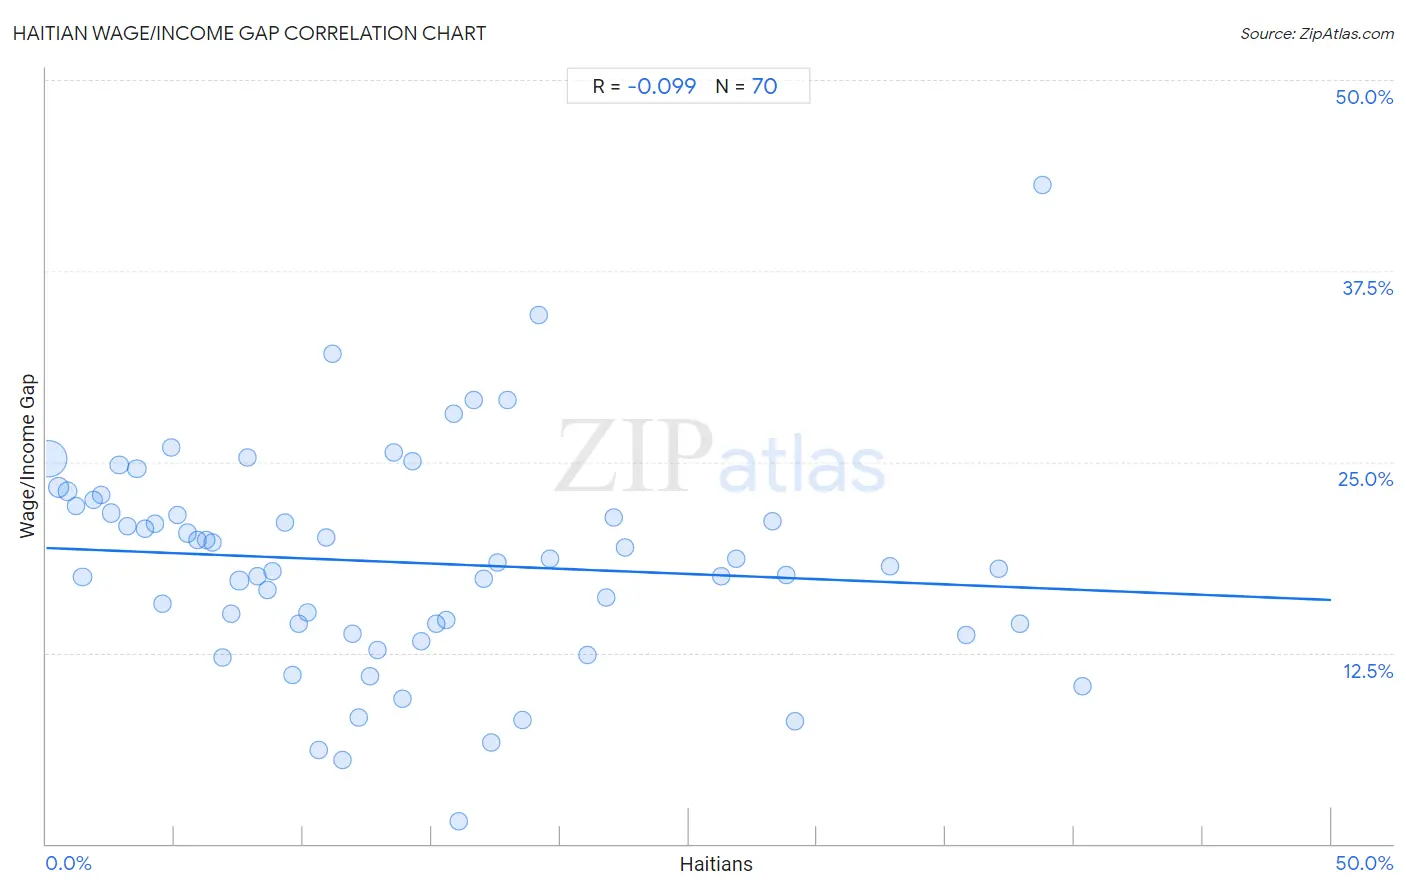
It is essential to understand that the correlation between the percentage of Haitians and wage/income gap percentage does not imply a direct cause-and-effect relationship. It remains uncertain whether the presence of Haitians influences an upward or downward trend in the level of wage/income gap percentage within an area, or if Haitians simply ended up residing in those areas with higher or lower levels of wage/income gap percentage due to other factors.
Demographics Similar to Haitians by Wage/Income Gap
In terms of wage/income gap, the demographic groups most similar to Haitians are Jamaican (19.6%, a difference of 0.78%), West Indian (19.6%, a difference of 0.91%), Hopi (20.0%, a difference of 1.4%), Immigrants from Dominica (20.0%, a difference of 1.4%), and Immigrants from Trinidad and Tobago (19.3%, a difference of 2.1%).
| Demographics | Rating | Rank | Wage/Income Gap |
| Crow | 100.0 /100 | #10 | Exceptional 19.1% |
| Immigrants from Haiti | 100.0 /100 | #11 | Exceptional 19.2% |
| Immigrants from West Indies | 100.0 /100 | #12 | Exceptional 19.2% |
| Trinidadians and Tobagonians | 100.0 /100 | #13 | Exceptional 19.3% |
| Immigrants from Trinidad and Tobago | 100.0 /100 | #14 | Exceptional 19.3% |
| West Indians | 100.0 /100 | #15 | Exceptional 19.6% |
| Jamaicans | 100.0 /100 | #16 | Exceptional 19.6% |
| Haitians | 100.0 /100 | #17 | Exceptional 19.7% |
| Hopi | 100.0 /100 | #18 | Exceptional 20.0% |
| Immigrants from Dominica | 100.0 /100 | #19 | Exceptional 20.0% |
| Bahamians | 100.0 /100 | #20 | Exceptional 20.2% |
| Immigrants from Caribbean | 100.0 /100 | #21 | Exceptional 20.4% |
| Immigrants from Liberia | 100.0 /100 | #22 | Exceptional 20.6% |
| Immigrants from Dominican Republic | 100.0 /100 | #23 | Exceptional 20.6% |
| Dominicans | 100.0 /100 | #24 | Exceptional 20.6% |
Haitian Wage/Income Gap Correlation Summary
| Measurement | Haitian Data | Wage/Income Gap Data |
| Minimum | 0.095% | 1.5% |
| Maximum | 40.3% | 43.2% |
| Range | 40.2% | 41.7% |
| Mean | 13.8% | 18.4% |
| Median | 11.7% | 18.3% |
| Interquartile 25% (IQ1) | 5.9% | 14.4% |
| Interquartile 75% (IQ3) | 18.5% | 22.1% |
| Interquartile Range (IQR) | 12.6% | 7.7% |
| Standard Deviation (Sample) | 10.3% | 7.1% |
| Standard Deviation (Population) | 10.2% | 7.0% |
Correlation Details
| Haitian Percentile | Sample Size | Wage/Income Gap |
[ 0.0% - 0.5% ] 0.095% | 203,763,434 | 25.2% |
[ 0.0% - 0.5% ] 0.48% | 30,031,116 | 23.3% |
[ 0.5% - 1.0% ] 0.81% | 12,965,884 | 23.1% |
[ 1.0% - 1.5% ] 1.15% | 6,772,685 | 22.1% |
[ 1.0% - 1.5% ] 1.41% | 12,324,098 | 17.5% |
[ 1.5% - 2.0% ] 1.83% | 3,038,105 | 22.5% |
[ 2.0% - 2.5% ] 2.15% | 2,365,758 | 22.8% |
[ 2.5% - 3.0% ] 2.53% | 1,391,180 | 21.6% |
[ 2.5% - 3.0% ] 2.84% | 1,309,295 | 24.8% |
[ 3.0% - 3.5% ] 3.16% | 2,350,954 | 20.8% |
[ 3.5% - 4.0% ] 3.52% | 904,461 | 24.6% |
[ 3.5% - 4.0% ] 3.82% | 958,850 | 20.6% |
[ 4.0% - 4.5% ] 4.21% | 331,748 | 21.0% |
[ 4.5% - 5.0% ] 4.53% | 763,934 | 15.7% |
[ 4.5% - 5.0% ] 4.85% | 307,041 | 26.0% |
[ 5.0% - 5.5% ] 5.12% | 756,623 | 21.6% |
[ 5.5% - 6.0% ] 5.50% | 414,815 | 20.3% |
[ 5.5% - 6.0% ] 5.88% | 490,287 | 19.9% |
[ 6.0% - 6.5% ] 6.22% | 705,846 | 19.9% |
[ 6.0% - 6.5% ] 6.47% | 160,947 | 19.8% |
[ 6.5% - 7.0% ] 6.84% | 403,554 | 12.2% |
[ 7.0% - 7.5% ] 7.20% | 215,788 | 15.1% |
[ 7.5% - 8.0% ] 7.51% | 450,380 | 17.2% |
[ 7.5% - 8.0% ] 7.85% | 174,274 | 25.3% |
[ 8.0% - 8.5% ] 8.21% | 576,572 | 17.5% |
[ 8.5% - 9.0% ] 8.60% | 207,256 | 16.6% |
[ 8.5% - 9.0% ] 8.81% | 118,037 | 17.9% |
[ 9.0% - 9.5% ] 9.29% | 188,944 | 21.1% |
[ 9.5% - 10.0% ] 9.57% | 79,212 | 11.0% |
[ 9.5% - 10.0% ] 9.81% | 53,626 | 14.4% |
[ 10.0% - 10.5% ] 10.18% | 375,633 | 15.2% |
[ 10.5% - 11.0% ] 10.62% | 34,860 | 6.2% |
[ 10.5% - 11.0% ] 10.88% | 45,801 | 20.1% |
[ 11.0% - 11.5% ] 11.13% | 72,397 | 32.1% |
[ 11.5% - 12.0% ] 11.55% | 32,311 | 5.5% |
[ 11.5% - 12.0% ] 11.92% | 208,772 | 13.8% |
[ 12.0% - 12.5% ] 12.16% | 153,053 | 8.3% |
[ 12.5% - 13.0% ] 12.62% | 98,037 | 11.0% |
[ 12.5% - 13.0% ] 12.90% | 179,860 | 12.7% |
[ 13.5% - 14.0% ] 13.50% | 232,750 | 25.6% |
[ 13.5% - 14.0% ] 13.85% | 180,853 | 9.5% |
[ 14.0% - 14.5% ] 14.26% | 94,219 | 25.1% |
[ 14.5% - 15.0% ] 14.61% | 103,341 | 13.3% |
[ 15.0% - 15.5% ] 15.19% | 144,317 | 14.4% |
[ 15.5% - 16.0% ] 15.59% | 207,337 | 14.7% |
[ 15.5% - 16.0% ] 15.86% | 33,709 | 28.2% |
[ 16.0% - 16.5% ] 16.07% | 26,814 | 1.5% |
[ 16.5% - 17.0% ] 16.65% | 14,585 | 29.0% |
[ 17.0% - 17.5% ] 17.04% | 118,661 | 17.4% |
[ 17.0% - 17.5% ] 17.33% | 62,604 | 6.6% |
[ 17.5% - 18.0% ] 17.57% | 86,232 | 18.4% |
[ 17.5% - 18.0% ] 17.94% | 37,241 | 29.0% |
[ 18.5% - 19.0% ] 18.53% | 64,176 | 8.1% |
[ 19.0% - 19.5% ] 19.19% | 10,946 | 34.6% |
[ 19.5% - 20.0% ] 19.62% | 70,810 | 18.7% |
[ 21.0% - 21.5% ] 21.04% | 62,232 | 12.3% |
[ 21.5% - 22.0% ] 21.79% | 83,221 | 16.1% |
[ 22.0% - 22.5% ] 22.08% | 40,276 | 21.4% |
[ 22.5% - 23.0% ] 22.54% | 43,269 | 19.4% |
[ 26.0% - 26.5% ] 26.25% | 5,882 | 17.5% |
[ 26.5% - 27.0% ] 26.83% | 35,914 | 18.6% |
[ 28.0% - 28.5% ] 28.25% | 31,807 | 21.1% |
[ 28.5% - 29.0% ] 28.78% | 24,792 | 17.6% |
[ 29.0% - 29.5% ] 29.13% | 1,775 | 8.0% |
[ 32.5% - 33.0% ] 32.84% | 48,326 | 18.2% |
[ 35.5% - 36.0% ] 35.77% | 17,163 | 13.7% |
[ 37.0% - 37.5% ] 37.04% | 52,824 | 18.0% |
[ 37.5% - 38.0% ] 37.88% | 59,854 | 14.4% |
[ 38.5% - 39.0% ] 38.75% | 2,867 | 43.2% |
[ 40.0% - 40.5% ] 40.35% | 58,183 | 10.3% |