Lockport Heights, LA Map & Demographics
Lockport Heights Map
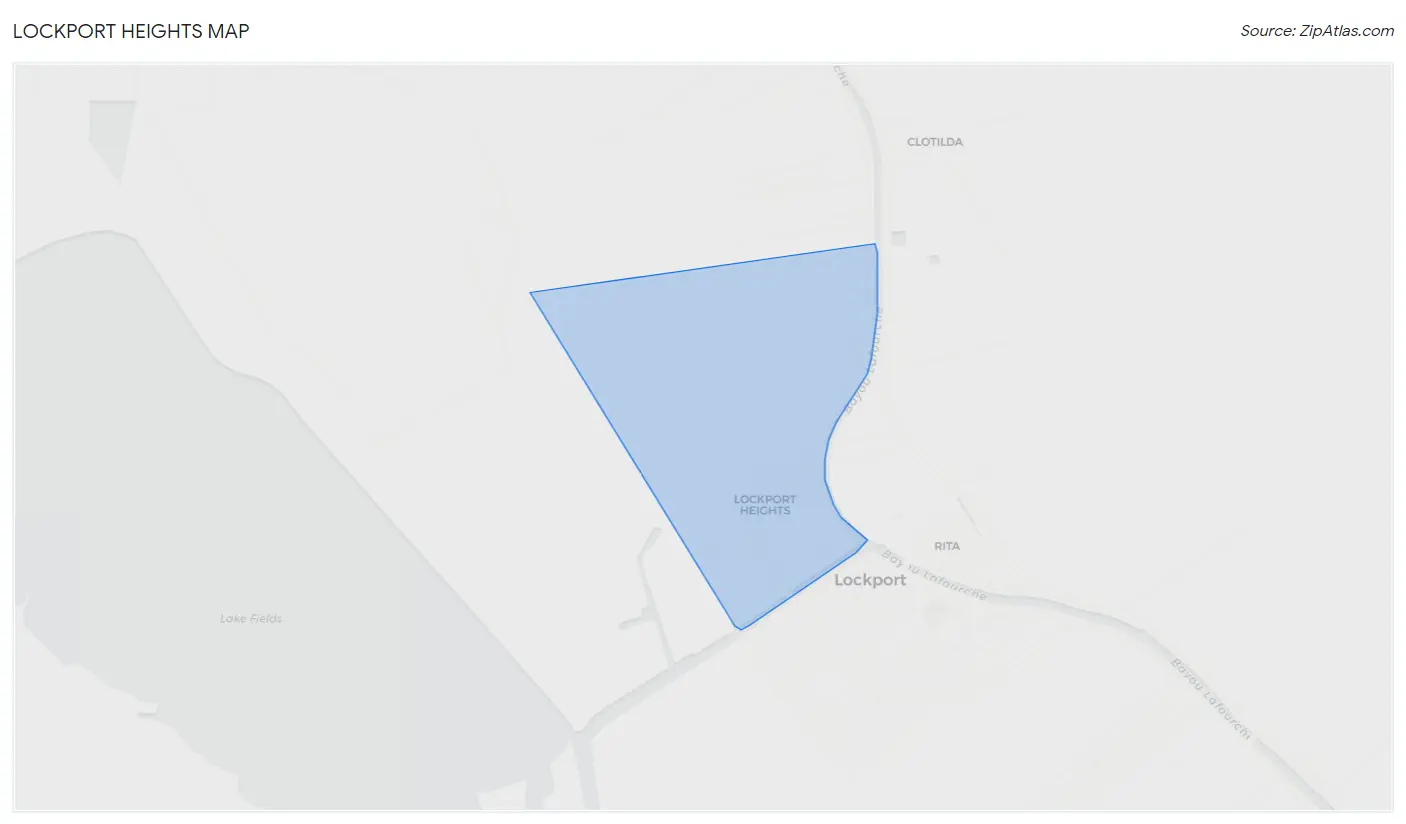
Lockport Heights Overview
$30,080
PER CAPITA INCOME
$100,924
AVG FAMILY INCOME
0.46
INEQUALITY / GINI INDEX
1,473
TOTAL POPULATION
693
MALE POPULATION
780
FEMALE POPULATION
88.85
MALES / 100 FEMALES
112.55
FEMALES / 100 MALES
32.2
MEDIAN AGE
3.2
AVG FAMILY SIZE
2.7
AVG HOUSEHOLD SIZE
690
LABOR FORCE [ PEOPLE ]
56.2%
PERCENT IN LABOR FORCE
Income in Lockport Heights
Income Overview in Lockport Heights
| Characteristic | Number | Measure |
| Per Capita Income | 1,473 | $30,080 |
| Median Family Income | 351 | $100,924 |
| Mean Family Income | 351 | $97,648 |
| Median Household Income | 550 | $0 |
| Mean Household Income | 550 | $76,183 |
| Income Deficit | 351 | $0 |
| Wage / Income Gap (%) | 1,473 | 0.00% |
| Wage / Income Gap ($) | 1,473 | 100.00¢ per $1 |
| Gini / Inequality Index | 1,473 | 0.46 |
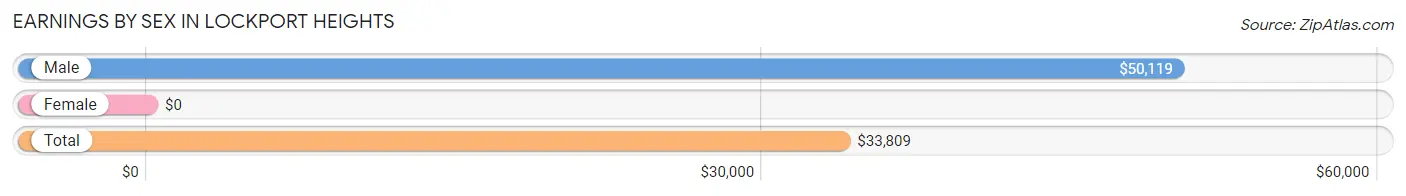
Earnings by Sex in Lockport Heights
| Sex | Number | Average Earnings |
| Male | 324 (41.5%) | $50,119 |
| Female | 457 (58.5%) | $0 |
| Total | 781 (100.0%) | $33,809 |
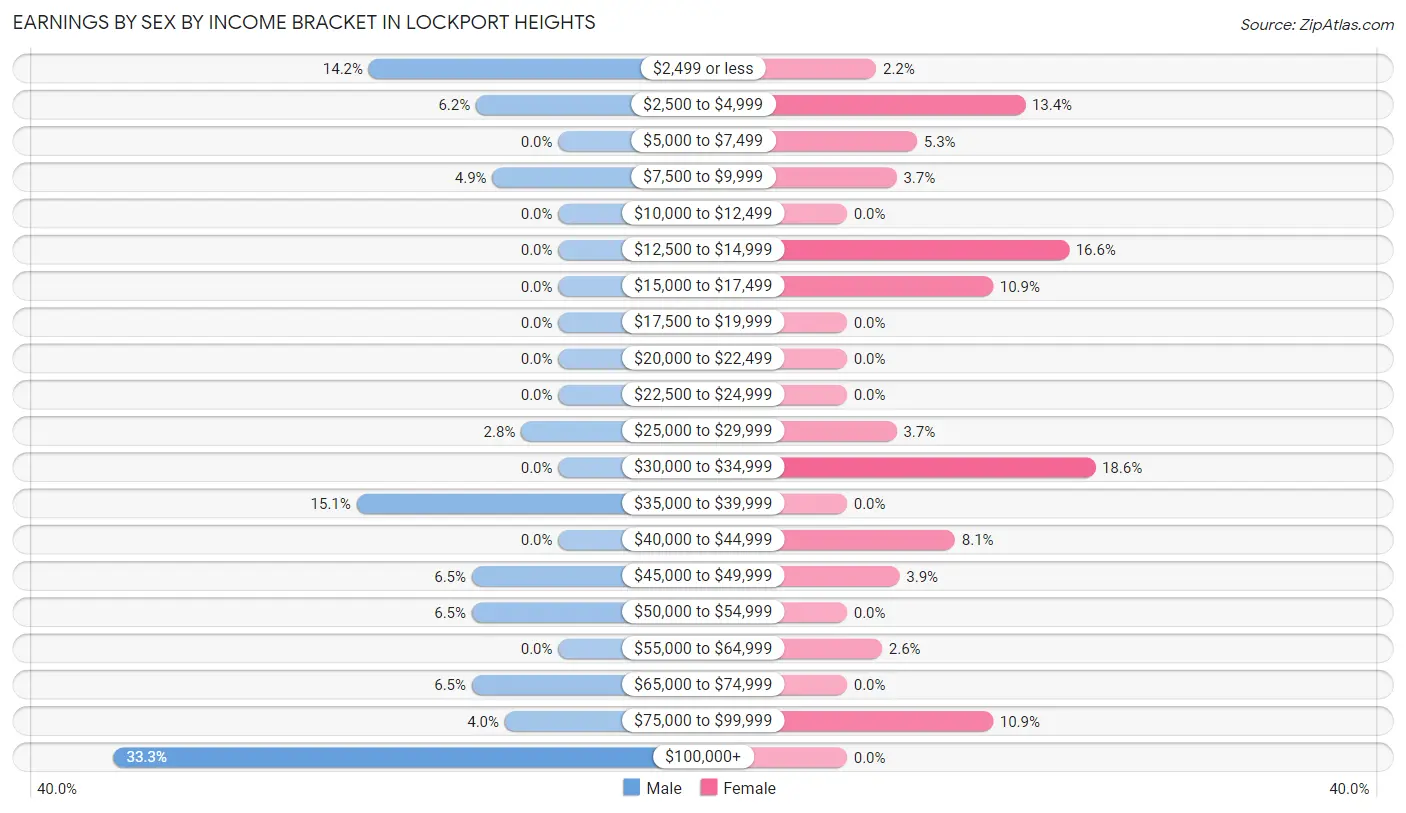
Earnings by Sex by Income Bracket in Lockport Heights
The most common earnings brackets in Lockport Heights are $100,000+ for men (108 | 33.3%) and $30,000 to $34,999 for women (85 | 18.6%).
| Income | Male | Female |
| $2,499 or less | 46 (14.2%) | 10 (2.2%) |
| $2,500 to $4,999 | 20 (6.2%) | 61 (13.4%) |
| $5,000 to $7,499 | 0 (0.0%) | 24 (5.2%) |
| $7,500 to $9,999 | 16 (4.9%) | 17 (3.7%) |
| $10,000 to $12,499 | 0 (0.0%) | 0 (0.0%) |
| $12,500 to $14,999 | 0 (0.0%) | 76 (16.6%) |
| $15,000 to $17,499 | 0 (0.0%) | 50 (10.9%) |
| $17,500 to $19,999 | 0 (0.0%) | 0 (0.0%) |
| $20,000 to $22,499 | 0 (0.0%) | 0 (0.0%) |
| $22,500 to $24,999 | 0 (0.0%) | 0 (0.0%) |
| $25,000 to $29,999 | 9 (2.8%) | 17 (3.7%) |
| $30,000 to $34,999 | 0 (0.0%) | 85 (18.6%) |
| $35,000 to $39,999 | 49 (15.1%) | 0 (0.0%) |
| $40,000 to $44,999 | 0 (0.0%) | 37 (8.1%) |
| $45,000 to $49,999 | 21 (6.5%) | 18 (3.9%) |
| $50,000 to $54,999 | 21 (6.5%) | 0 (0.0%) |
| $55,000 to $64,999 | 0 (0.0%) | 12 (2.6%) |
| $65,000 to $74,999 | 21 (6.5%) | 0 (0.0%) |
| $75,000 to $99,999 | 13 (4.0%) | 50 (10.9%) |
| $100,000+ | 108 (33.3%) | 0 (0.0%) |
| Total | 324 (100.0%) | 457 (100.0%) |
Earnings by Sex by Educational Attainment in Lockport Heights
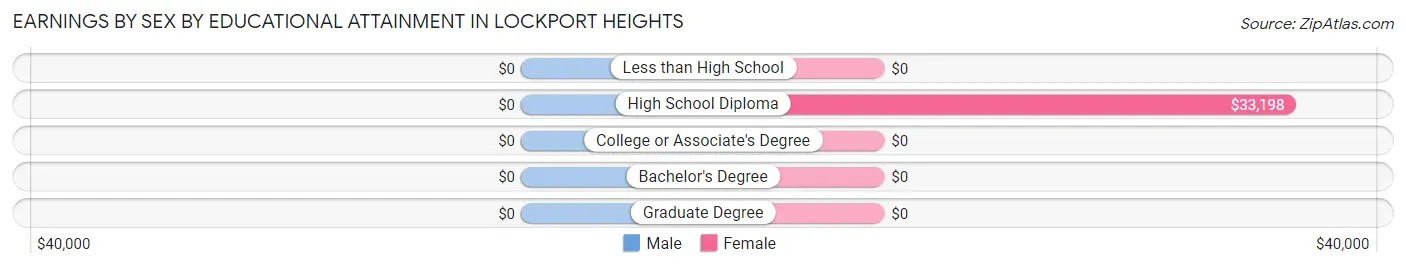
| Educational Attainment | Male Income | Female Income |
| Less than High School | - | - |
| High School Diploma | - | - |
| College or Associate's Degree | - | - |
| Bachelor's Degree | - | - |
| Graduate Degree | - | - |
| Total | - | - |
Family Income in Lockport Heights
Family Income Brackets in Lockport Heights
According to the Lockport Heights family income data, there are 122 families falling into the $100,000 to $149,999 income range, which is the most common income bracket and makes up 34.8% of all families.
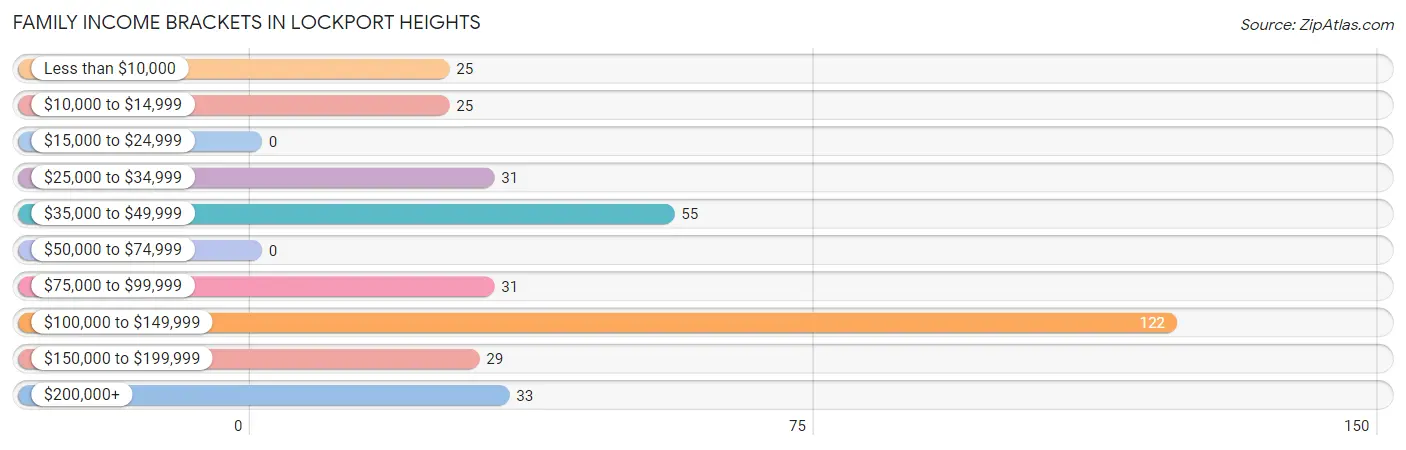
| Income Bracket | # Families | % Families |
| Less than $10,000 | 25 | 7.1% |
| $10,000 to $14,999 | 25 | 7.1% |
| $15,000 to $24,999 | 0 | 0.0% |
| $25,000 to $34,999 | 31 | 8.8% |
| $35,000 to $49,999 | 55 | 15.7% |
| $50,000 to $74,999 | 0 | 0.0% |
| $75,000 to $99,999 | 31 | 8.8% |
| $100,000 to $149,999 | 122 | 34.8% |
| $150,000 to $199,999 | 29 | 8.3% |
| $200,000+ | 33 | 9.4% |
Family Income by Famaliy Size in Lockport Heights
5-person families (109 | 31.0%) account for the highest median family income in Lockport Heights with $116,673 per family, while 5-person families (109 | 31.0%) have the highest median income of $23,335 per family member.
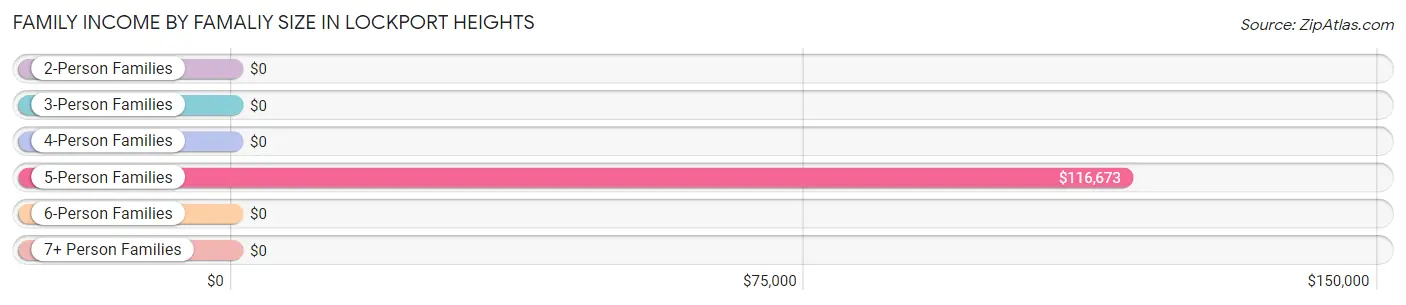
| Income Bracket | # Families | Median Income |
| 2-Person Families | 131 (37.3%) | $0 |
| 3-Person Families | 93 (26.5%) | $0 |
| 4-Person Families | 18 (5.1%) | $0 |
| 5-Person Families | 109 (31.0%) | $116,673 |
| 6-Person Families | 0 (0.0%) | $0 |
| 7+ Person Families | 0 (0.0%) | $0 |
| Total | 351 (100.0%) | $100,924 |
Family Income by Number of Earners in Lockport Heights
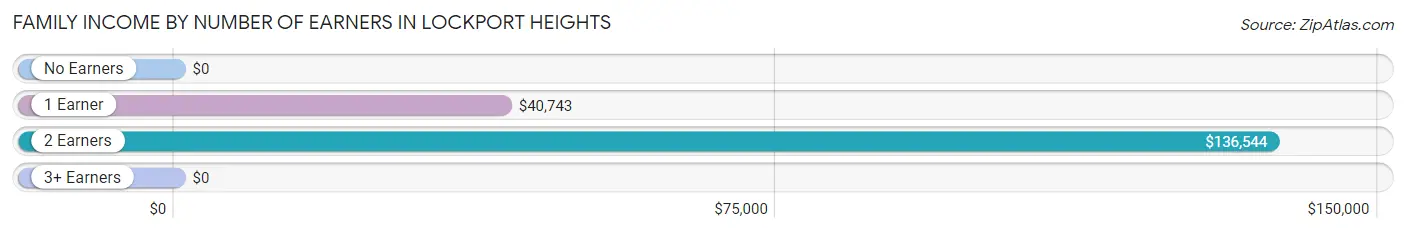
| Number of Earners | # Families | Median Income |
| No Earners | 53 (15.1%) | $0 |
| 1 Earner | 96 (27.4%) | $40,743 |
| 2 Earners | 137 (39.0%) | $136,544 |
| 3+ Earners | 65 (18.5%) | $0 |
| Total | 351 (100.0%) | $100,924 |
Household Income in Lockport Heights
Household Income Brackets in Lockport Heights
With 154 households falling in the category, the $35,000 to $49,999 income range is the most frequent in Lockport Heights, accounting for 28.0% of all households. In contrast, only 22 households (4.0%) fall into the $25,000 to $34,999 income bracket, making it the least populous group.
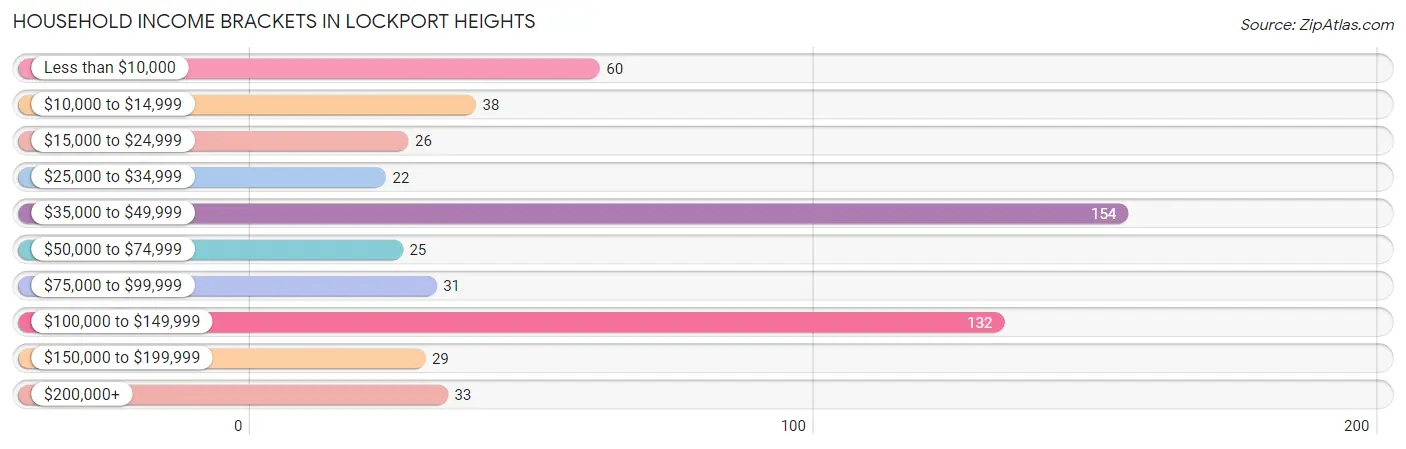
| Income Bracket | # Households | % Households |
| Less than $10,000 | 60 | 10.9% |
| $10,000 to $14,999 | 38 | 6.9% |
| $15,000 to $24,999 | 26 | 4.7% |
| $25,000 to $34,999 | 22 | 4.0% |
| $35,000 to $49,999 | 154 | 28.0% |
| $50,000 to $74,999 | 25 | 4.5% |
| $75,000 to $99,999 | 31 | 5.6% |
| $100,000 to $149,999 | 132 | 24.0% |
| $150,000 to $199,999 | 29 | 5.3% |
| $200,000+ | 33 | 6.0% |
Household Income by Householder Age in Lockport Heights
The median household income in Lockport Heights is $0, with the highest median household income of $115,154 found in the 25 to 44 years age bracket for the primary householder. A total of 232 households (42.2%) fall into this category. Meanwhile, the 45 to 64 years age bracket for the primary householder has the lowest median household income of $0, with 178 households (32.4%) in this group.
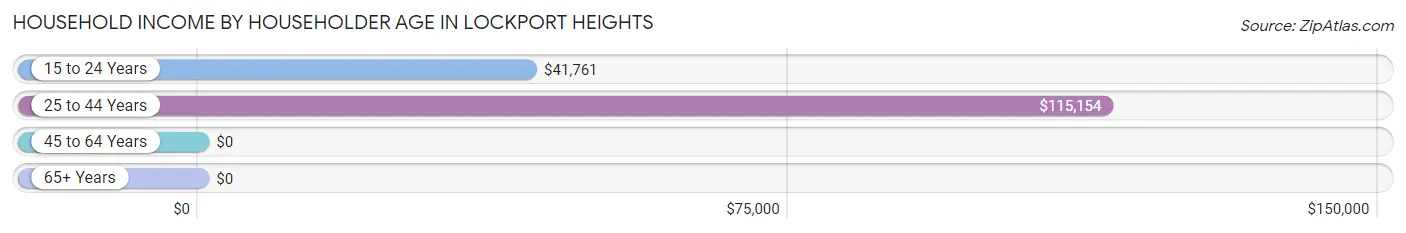
| Income Bracket | # Households | Median Income |
| 15 to 24 Years | 62 (11.3%) | $41,761 |
| 25 to 44 Years | 232 (42.2%) | $115,154 |
| 45 to 64 Years | 178 (32.4%) | $0 |
| 65+ Years | 78 (14.2%) | $0 |
| Total | 550 (100.0%) | $0 |
Poverty in Lockport Heights
Income Below Poverty by Sex and Age in Lockport Heights
With 19.9% poverty level for males and 21.1% for females among the residents of Lockport Heights, 25 to 34 year old males and 6 to 11 year old females are the most vulnerable to poverty, with 66 males (88.0%) and 10 females (100.0%) in their respective age groups living below the poverty level.
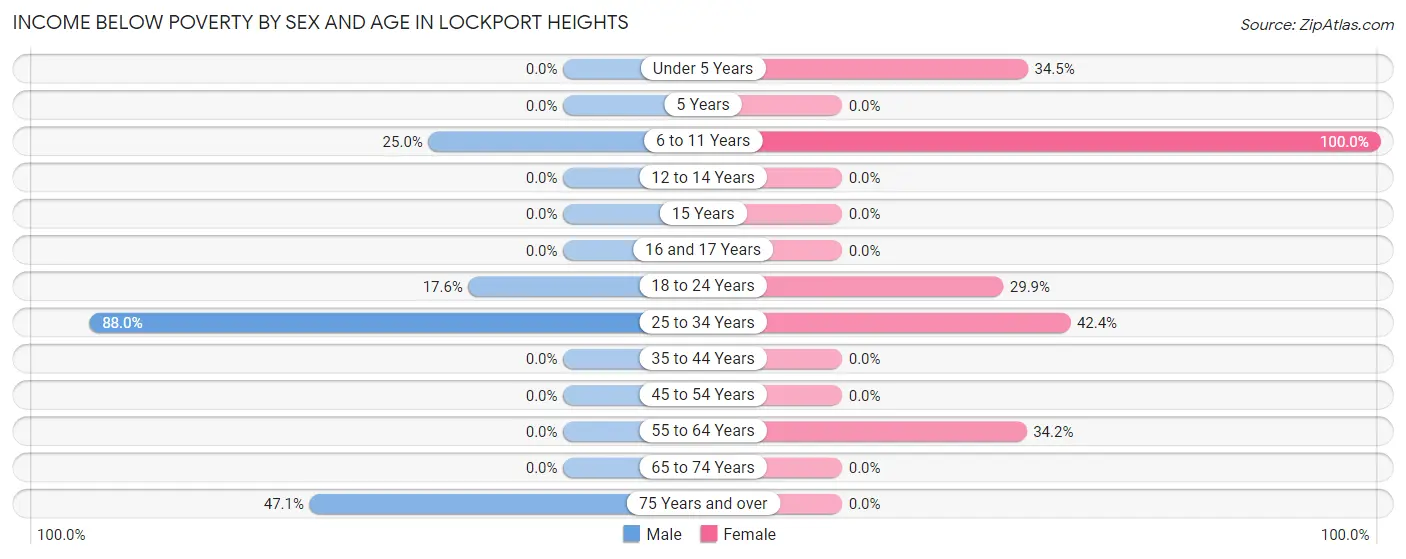
| Age Bracket | Male | Female |
| Under 5 Years | 0 (0.0%) | 20 (34.5%) |
| 5 Years | 0 (0.0%) | 0 (0.0%) |
| 6 to 11 Years | 22 (25.0%) | 10 (100.0%) |
| 12 to 14 Years | 0 (0.0%) | 0 (0.0%) |
| 15 Years | 0 (0.0%) | 0 (0.0%) |
| 16 and 17 Years | 0 (0.0%) | 0 (0.0%) |
| 18 to 24 Years | 26 (17.6%) | 61 (29.9%) |
| 25 to 34 Years | 66 (88.0%) | 36 (42.3%) |
| 35 to 44 Years | 0 (0.0%) | 0 (0.0%) |
| 45 to 54 Years | 0 (0.0%) | 0 (0.0%) |
| 55 to 64 Years | 0 (0.0%) | 38 (34.2%) |
| 65 to 74 Years | 0 (0.0%) | 0 (0.0%) |
| 75 Years and over | 24 (47.1%) | 0 (0.0%) |
| Total | 138 (19.9%) | 165 (21.1%) |
Income Above Poverty by Sex and Age in Lockport Heights
According to the poverty statistics in Lockport Heights, males aged 12 to 14 years and females aged 5 years are the age groups that are most secure financially, with 100.0% of males and 100.0% of females in these age groups living above the poverty line.
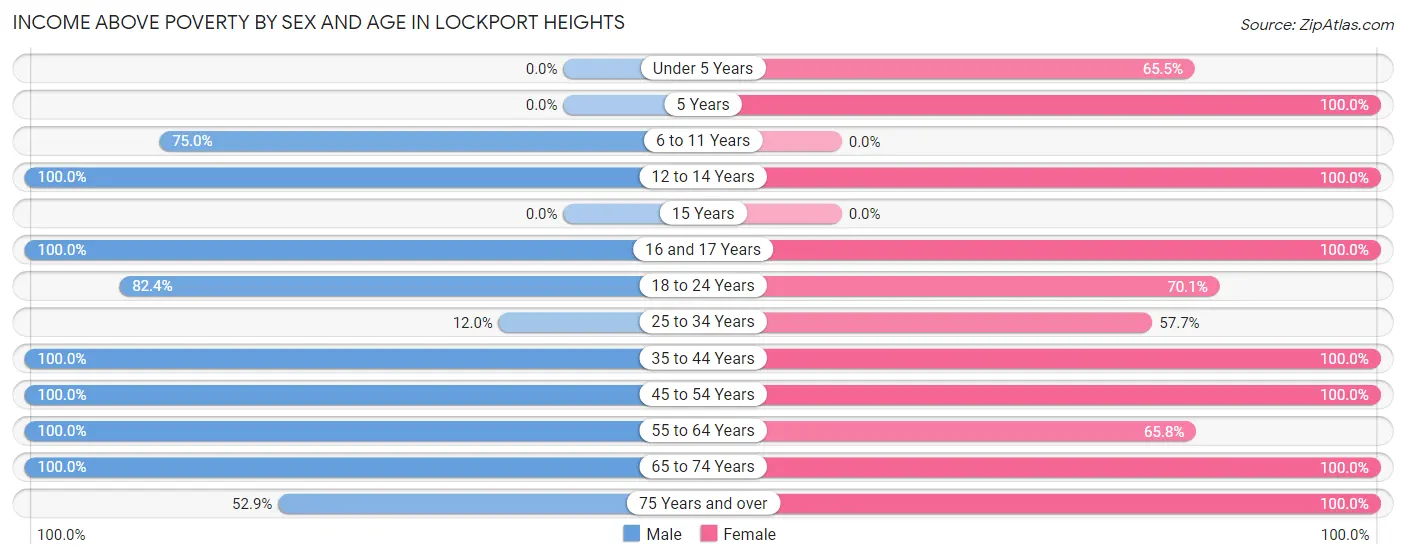
| Age Bracket | Male | Female |
| Under 5 Years | 0 (0.0%) | 38 (65.5%) |
| 5 Years | 0 (0.0%) | 10 (100.0%) |
| 6 to 11 Years | 66 (75.0%) | 0 (0.0%) |
| 12 to 14 Years | 56 (100.0%) | 23 (100.0%) |
| 15 Years | 0 (0.0%) | 0 (0.0%) |
| 16 and 17 Years | 22 (100.0%) | 29 (100.0%) |
| 18 to 24 Years | 122 (82.4%) | 143 (70.1%) |
| 25 to 34 Years | 9 (12.0%) | 49 (57.7%) |
| 35 to 44 Years | 86 (100.0%) | 157 (100.0%) |
| 45 to 54 Years | 88 (100.0%) | 38 (100.0%) |
| 55 to 64 Years | 70 (100.0%) | 73 (65.8%) |
| 65 to 74 Years | 9 (100.0%) | 17 (100.0%) |
| 75 Years and over | 27 (52.9%) | 38 (100.0%) |
| Total | 555 (80.1%) | 615 (78.8%) |
Income Below Poverty Among Married-Couple Families in Lockport Heights
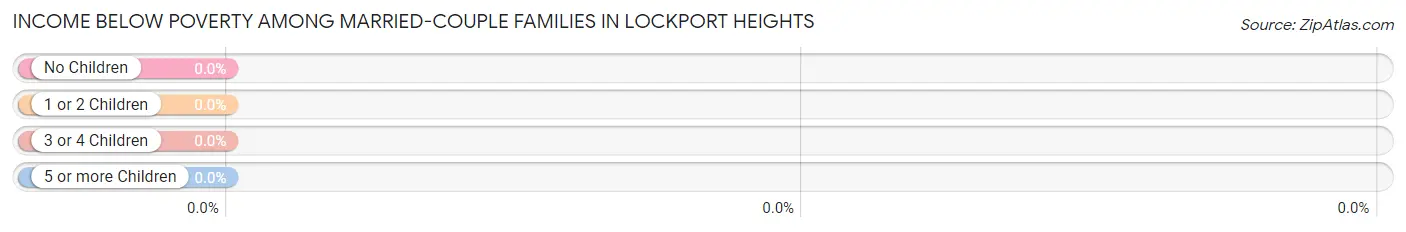
| Children | Above Poverty | Below Poverty |
| No Children | 168 (100.0%) | 0 (0.0%) |
| 1 or 2 Children | 51 (100.0%) | 0 (0.0%) |
| 3 or 4 Children | 33 (100.0%) | 0 (0.0%) |
| 5 or more Children | 0 (0.0%) | 0 (0.0%) |
| Total | 252 (100.0%) | 0 (0.0%) |
Income Below Poverty Among Single-Parent Households in Lockport Heights
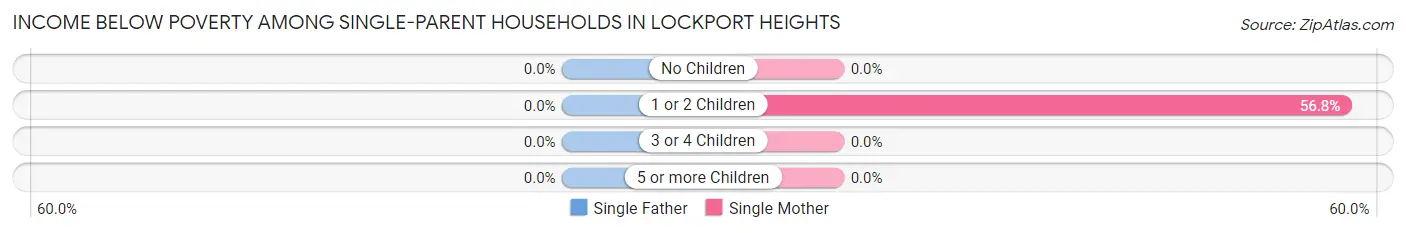
| Children | Single Father | Single Mother |
| No Children | 0 (0.0%) | 0 (0.0%) |
| 1 or 2 Children | 0 (0.0%) | 50 (56.8%) |
| 3 or 4 Children | 0 (0.0%) | 0 (0.0%) |
| 5 or more Children | 0 (0.0%) | 0 (0.0%) |
| Total | 0 (0.0%) | 50 (50.5%) |
Income Below Poverty Among Married-Couple vs Single-Parent Households in Lockport Heights
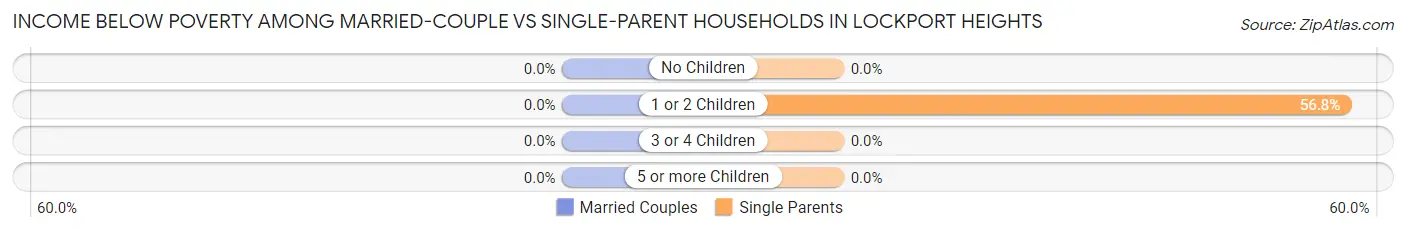
| Children | Married-Couple Families | Single-Parent Households |
| No Children | 0 (0.0%) | 0 (0.0%) |
| 1 or 2 Children | 0 (0.0%) | 50 (56.8%) |
| 3 or 4 Children | 0 (0.0%) | 0 (0.0%) |
| 5 or more Children | 0 (0.0%) | 0 (0.0%) |
| Total | 0 (0.0%) | 50 (50.5%) |
Race in Lockport Heights
The most populous races in Lockport Heights are White / Caucasian (1,422 | 96.5%), Black / African American (29 | 2.0%), and Native / Alaskan (17 | 1.1%).
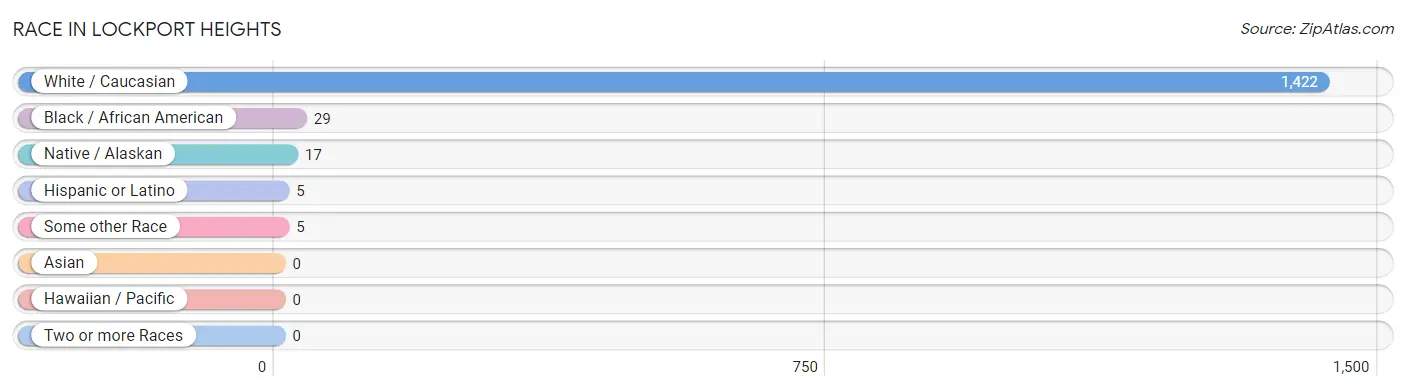
| Race | # Population | % Population |
| Asian | 0 | 0.0% |
| Black / African American | 29 | 2.0% |
| Hawaiian / Pacific | 0 | 0.0% |
| Hispanic or Latino | 5 | 0.3% |
| Native / Alaskan | 17 | 1.1% |
| White / Caucasian | 1,422 | 96.5% |
| Two or more Races | 0 | 0.0% |
| Some other Race | 5 | 0.3% |
| Total | 1,473 | 100.0% |
Ancestry in Lockport Heights
The most populous ancestries reported in Lockport Heights are French (309 | 21.0%), Italian (171 | 11.6%), Cajun (142 | 9.6%), Irish (109 | 7.4%), and German (65 | 4.4%), together accounting for 54.0% of all Lockport Heights residents.
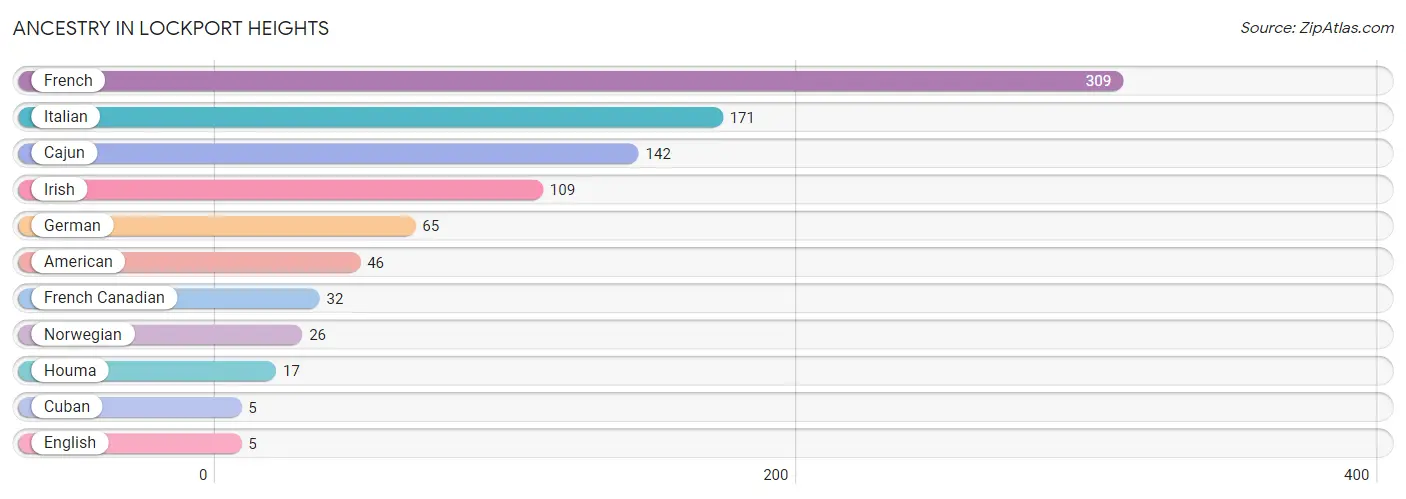
| Ancestry | # Population | % Population |
| American | 46 | 3.1% |
| Cajun | 142 | 9.6% |
| Cuban | 5 | 0.3% |
| English | 5 | 0.3% |
| French | 309 | 21.0% |
| French Canadian | 32 | 2.2% |
| German | 65 | 4.4% |
| Houma | 17 | 1.1% |
| Irish | 109 | 7.4% |
| Italian | 171 | 11.6% |
| Norwegian | 26 | 1.8% | View All 11 Rows |
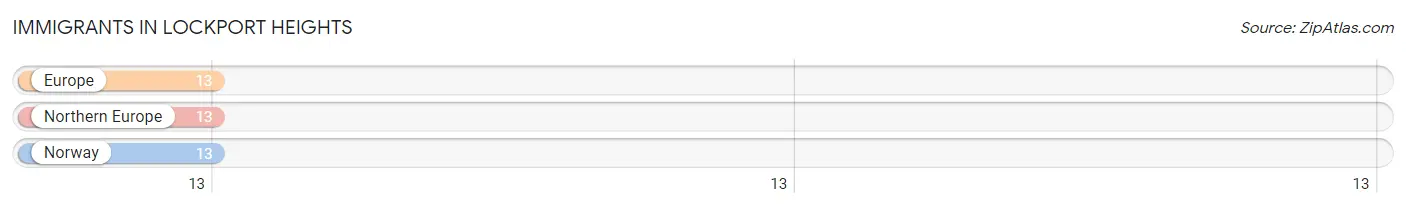
Immigrants in Lockport Heights
The most numerous immigrant groups reported in Lockport Heights came from Europe (13 | 0.9%), Northern Europe (13 | 0.9%), and Norway (13 | 0.9%), together accounting for 2.6% of all Lockport Heights residents.
| Immigration Origin | # Population | % Population |
| Europe | 13 | 0.9% |
| Northern Europe | 13 | 0.9% |
| Norway | 13 | 0.9% | View All 3 Rows |
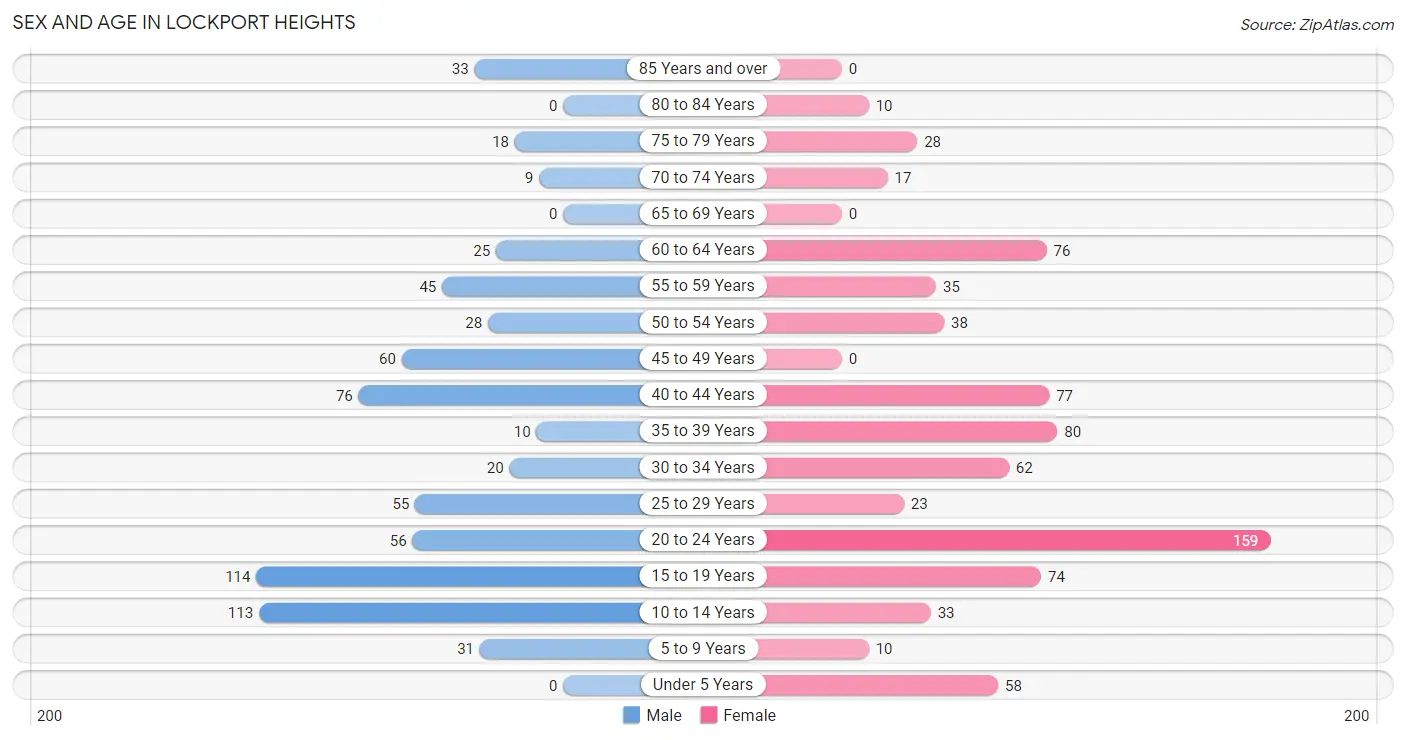
Sex and Age in Lockport Heights
Sex and Age in Lockport Heights
The most populous age groups in Lockport Heights are 15 to 19 Years (114 | 16.5%) for men and 20 to 24 Years (159 | 20.4%) for women.
| Age Bracket | Male | Female |
| Under 5 Years | 0 (0.0%) | 58 (7.4%) |
| 5 to 9 Years | 31 (4.5%) | 10 (1.3%) |
| 10 to 14 Years | 113 (16.3%) | 33 (4.2%) |
| 15 to 19 Years | 114 (16.5%) | 74 (9.5%) |
| 20 to 24 Years | 56 (8.1%) | 159 (20.4%) |
| 25 to 29 Years | 55 (7.9%) | 23 (2.9%) |
| 30 to 34 Years | 20 (2.9%) | 62 (8.0%) |
| 35 to 39 Years | 10 (1.4%) | 80 (10.3%) |
| 40 to 44 Years | 76 (11.0%) | 77 (9.9%) |
| 45 to 49 Years | 60 (8.7%) | 0 (0.0%) |
| 50 to 54 Years | 28 (4.0%) | 38 (4.9%) |
| 55 to 59 Years | 45 (6.5%) | 35 (4.5%) |
| 60 to 64 Years | 25 (3.6%) | 76 (9.7%) |
| 65 to 69 Years | 0 (0.0%) | 0 (0.0%) |
| 70 to 74 Years | 9 (1.3%) | 17 (2.2%) |
| 75 to 79 Years | 18 (2.6%) | 28 (3.6%) |
| 80 to 84 Years | 0 (0.0%) | 10 (1.3%) |
| 85 Years and over | 33 (4.8%) | 0 (0.0%) |
| Total | 693 (100.0%) | 780 (100.0%) |
Families and Households in Lockport Heights
Median Family Size in Lockport Heights

| Family Type | # Families | Family Size |
| Married-Couple | 252 (71.8%) | 3.44 |
| Single Male/Father | 0 (0.0%) | - |
| Single Female/Mother | 99 (28.2%) | 2.67 |
| Total Families | 351 (100.0%) | 3.22 |
Median Household Size in Lockport Heights

| Household Type | # Households | Household Size |
| Married-Couple | 252 (45.8%) | 3.50 |
| Single Male/Father | 0 (0.0%) | - |
| Single Female/Mother | 99 (18.0%) | 2.87 |
| Non-family | 199 (36.2%) | 1.54 |
| Total Households | 550 (100.0%) | 2.68 |
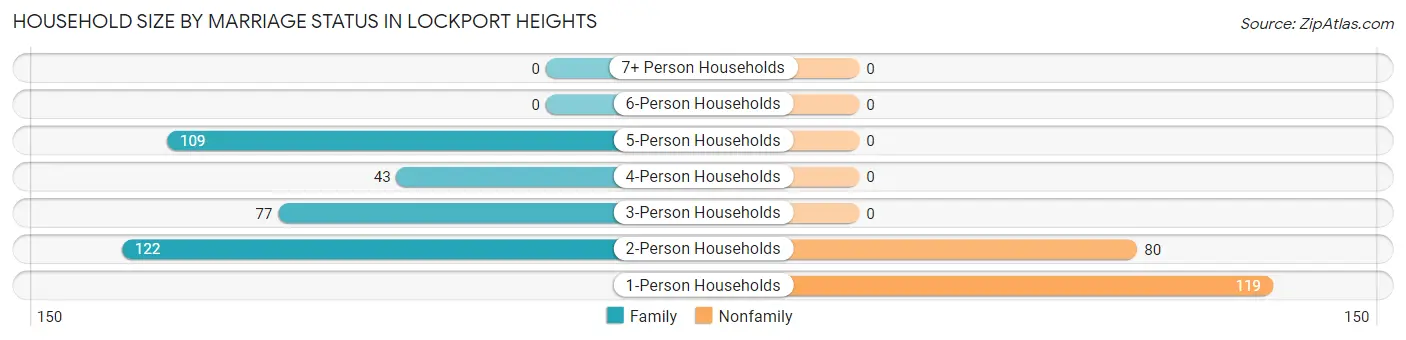
Household Size by Marriage Status in Lockport Heights
Out of a total of 550 households in Lockport Heights, 351 (63.8%) are family households, while 199 (36.2%) are nonfamily households. The most numerous type of family households are 2-person households, comprising 122, and the most common type of nonfamily households are 1-person households, comprising 119.
| Household Size | Family Households | Nonfamily Households |
| 1-Person Households | - | 119 (21.6%) |
| 2-Person Households | 122 (22.2%) | 80 (14.5%) |
| 3-Person Households | 77 (14.0%) | 0 (0.0%) |
| 4-Person Households | 43 (7.8%) | 0 (0.0%) |
| 5-Person Households | 109 (19.8%) | 0 (0.0%) |
| 6-Person Households | 0 (0.0%) | 0 (0.0%) |
| 7+ Person Households | 0 (0.0%) | 0 (0.0%) |
| Total | 351 (63.8%) | 199 (36.2%) |
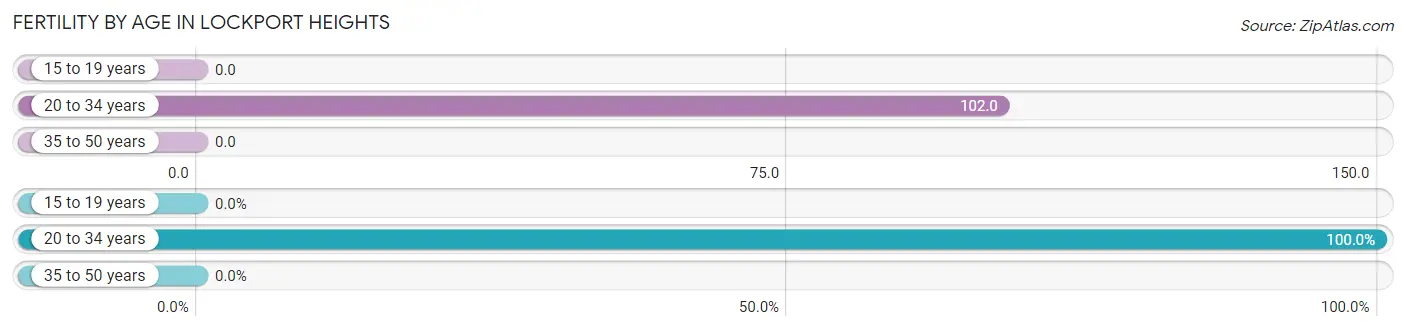
Female Fertility in Lockport Heights
Fertility by Age in Lockport Heights
Average fertility rate in Lockport Heights is 53.0 births per 1,000 women. Women in the age bracket of 20 to 34 years have the highest fertility rate with 102.0 births per 1,000 women. Women in the age bracket of 20 to 34 years acount for 100.0% of all women with births.
| Age Bracket | Women with Births | Births / 1,000 Women |
| 15 to 19 years | 0 (0.0%) | 0.0 |
| 20 to 34 years | 25 (100.0%) | 102.0 |
| 35 to 50 years | 0 (0.0%) | 0.0 |
| Total | 25 (100.0%) | 53.0 |
Fertility by Age by Marriage Status in Lockport Heights
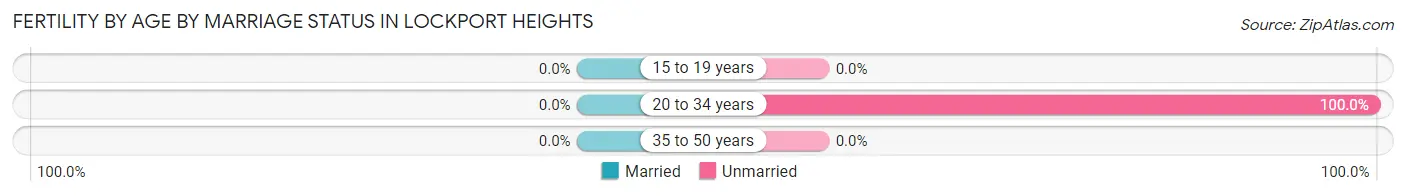
| Age Bracket | Married | Unmarried |
| 15 to 19 years | 0 (0.0%) | 0 (0.0%) |
| 20 to 34 years | 0 (0.0%) | 25 (100.0%) |
| 35 to 50 years | 0 (0.0%) | 0 (0.0%) |
| Total | 0 (0.0%) | 25 (100.0%) |
Fertility by Education in Lockport Heights
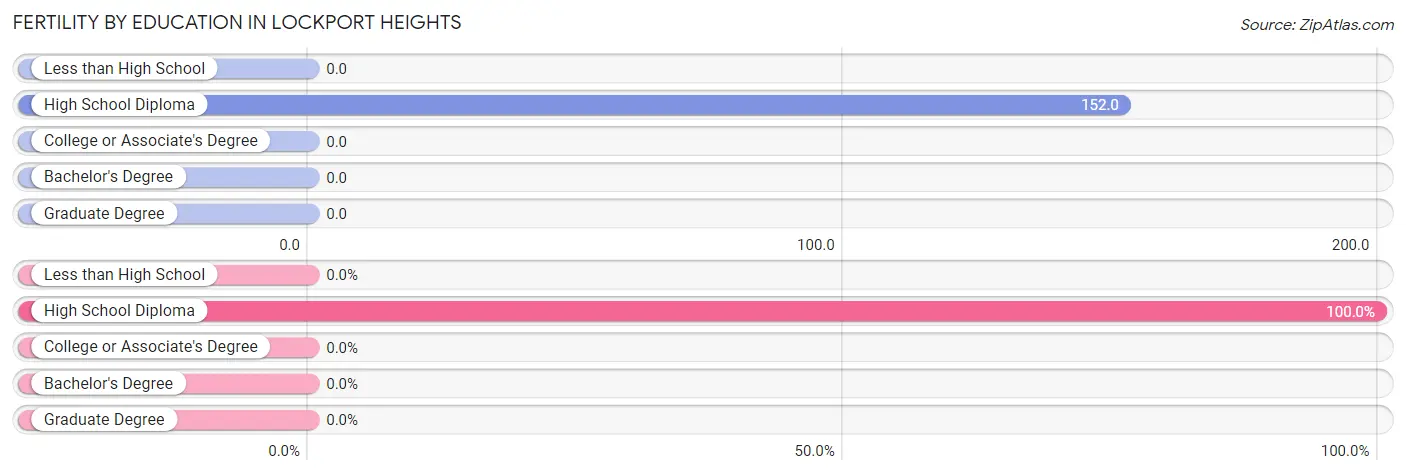
| Educational Attainment | Women with Births | Births / 1,000 Women |
| Less than High School | 0 (0.0%) | 0.0 |
| High School Diploma | 25 (100.0%) | 152.0 |
| College or Associate's Degree | 0 (0.0%) | 0.0 |
| Bachelor's Degree | 0 (0.0%) | 0.0 |
| Graduate Degree | 0 (0.0%) | 0.0 |
| Total | 25 (100.0%) | 53.0 |
Fertility by Education by Marriage Status in Lockport Heights
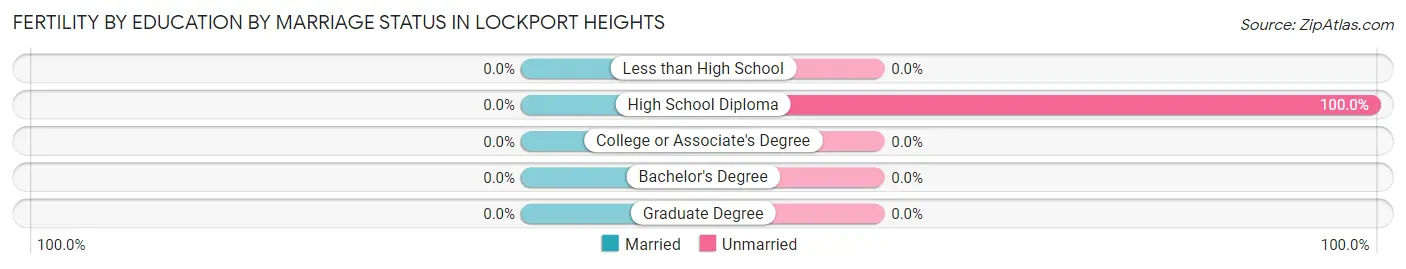
| Educational Attainment | Married | Unmarried |
| Less than High School | 0 (0.0%) | 0 (0.0%) |
| High School Diploma | 0 (0.0%) | 25 (100.0%) |
| College or Associate's Degree | 0 (0.0%) | 0 (0.0%) |
| Bachelor's Degree | 0 (0.0%) | 0 (0.0%) |
| Graduate Degree | 0 (0.0%) | 0 (0.0%) |
| Total | 0 (0.0%) | 25 (100.0%) |
Employment Characteristics in Lockport Heights
Employment by Class of Employer in Lockport Heights
Among the 690 employed individuals in Lockport Heights, private company employees (518 | 75.1%), state government employees (86 | 12.5%), and self-employed (incorporated) (46 | 6.7%) make up the most common classes of employment.
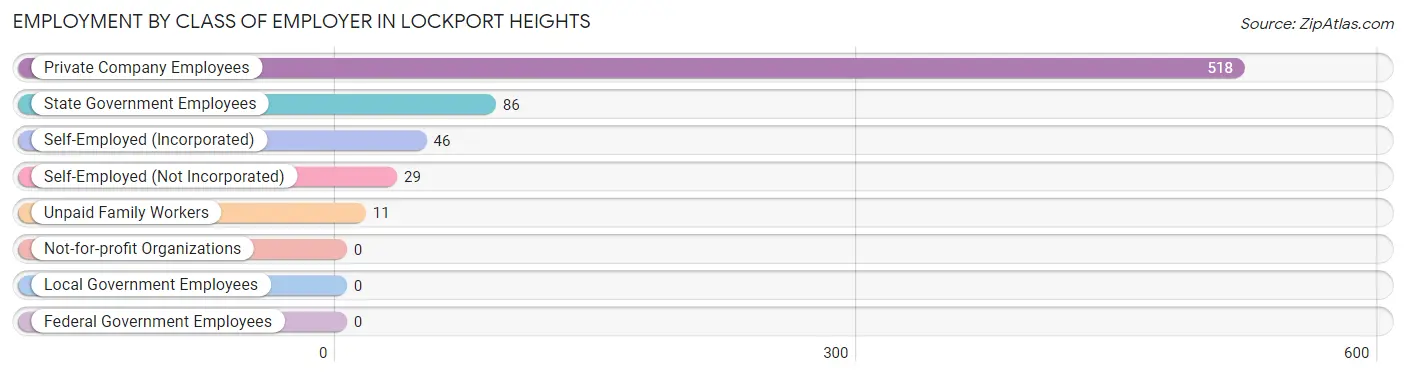
| Employer Class | # Employees | % Employees |
| Private Company Employees | 518 | 75.1% |
| Self-Employed (Incorporated) | 46 | 6.7% |
| Self-Employed (Not Incorporated) | 29 | 4.2% |
| Not-for-profit Organizations | 0 | 0.0% |
| Local Government Employees | 0 | 0.0% |
| State Government Employees | 86 | 12.5% |
| Federal Government Employees | 0 | 0.0% |
| Unpaid Family Workers | 11 | 1.6% |
| Total | 690 | 100.0% |
Employment Status by Age in Lockport Heights
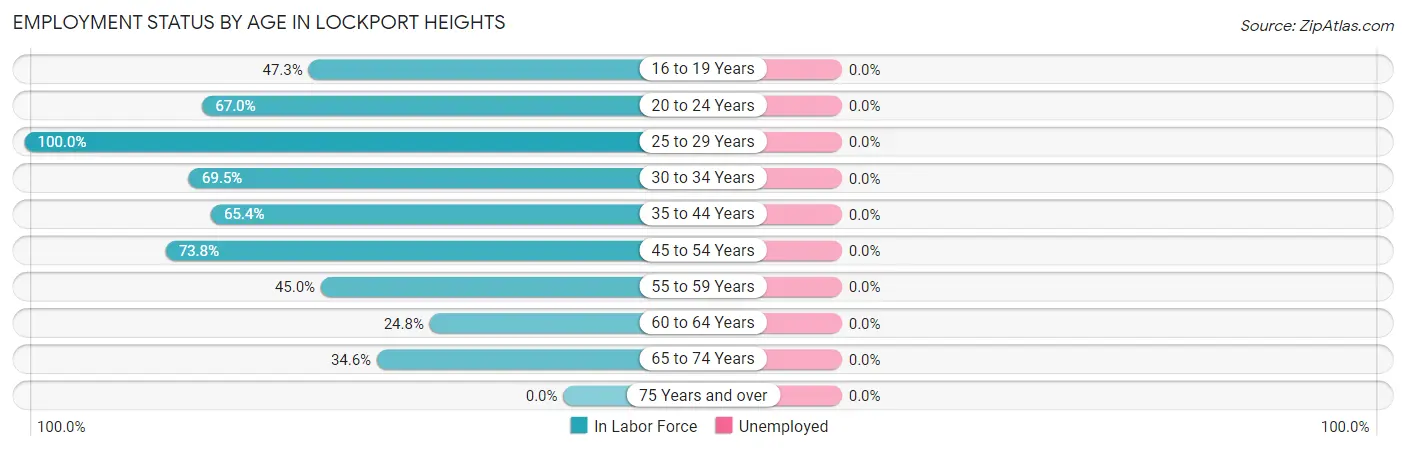
| Age Bracket | In Labor Force | Unemployed |
| 16 to 19 Years | 89 (47.3%) | 0 (0.0%) |
| 20 to 24 Years | 144 (67.0%) | 0 (0.0%) |
| 25 to 29 Years | 78 (100.0%) | 0 (0.0%) |
| 30 to 34 Years | 57 (69.5%) | 0 (0.0%) |
| 35 to 44 Years | 159 (65.4%) | 0 (0.0%) |
| 45 to 54 Years | 93 (73.8%) | 0 (0.0%) |
| 55 to 59 Years | 36 (45.0%) | 0 (0.0%) |
| 60 to 64 Years | 25 (24.8%) | 0 (0.0%) |
| 65 to 74 Years | 9 (34.6%) | 0 (0.0%) |
| 75 Years and over | 0 (0.0%) | 0 (0.0%) |
| Total | 690 (56.2%) | 0 (0.0%) |
Employment Status by Educational Attainment in Lockport Heights
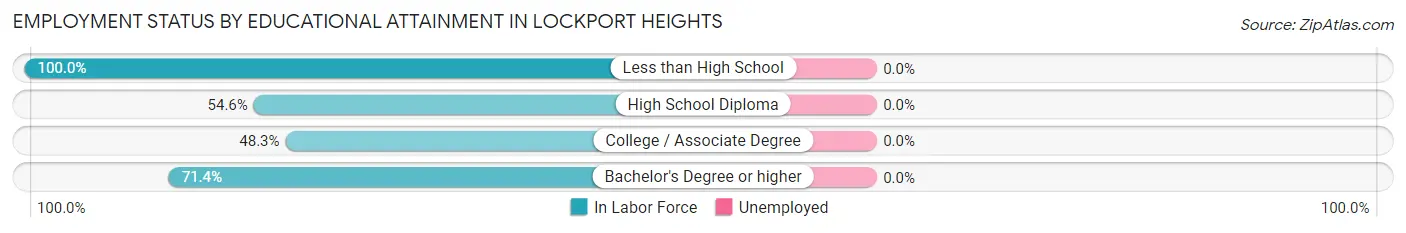
| Educational Attainment | In Labor Force | Unemployed |
| Less than High School | 77 (100.0%) | 0 (0.0%) |
| High School Diploma | 155 (54.6%) | 0 (0.0%) |
| College / Associate Degree | 69 (48.3%) | 0 (0.0%) |
| Bachelor's Degree or higher | 147 (71.4%) | 0 (0.0%) |
| Total | 448 (63.1%) | 0 (0.0%) |
Employment Occupations by Sex in Lockport Heights
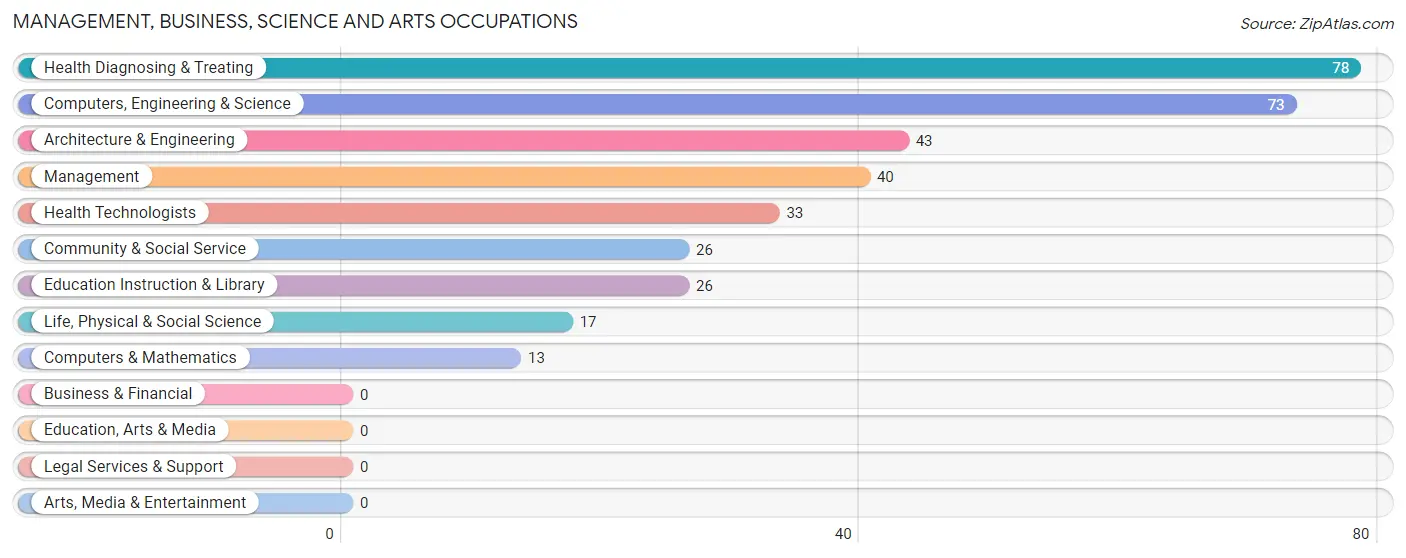
Management, Business, Science and Arts Occupations
The most common Management, Business, Science and Arts occupations in Lockport Heights are Health Diagnosing & Treating (78 | 11.3%), Computers, Engineering & Science (73 | 10.6%), Architecture & Engineering (43 | 6.2%), Management (40 | 5.8%), and Health Technologists (33 | 4.8%).
Management, Business, Science and Arts Occupations by Sex
Within the Management, Business, Science and Arts occupations in Lockport Heights, the most male-oriented occupations are Management (100.0%), Computers & Mathematics (100.0%), and Life, Physical & Social Science (100.0%), while the most female-oriented occupations are Health Diagnosing & Treating (100.0%), Health Technologists (100.0%), and Community & Social Service (69.2%).
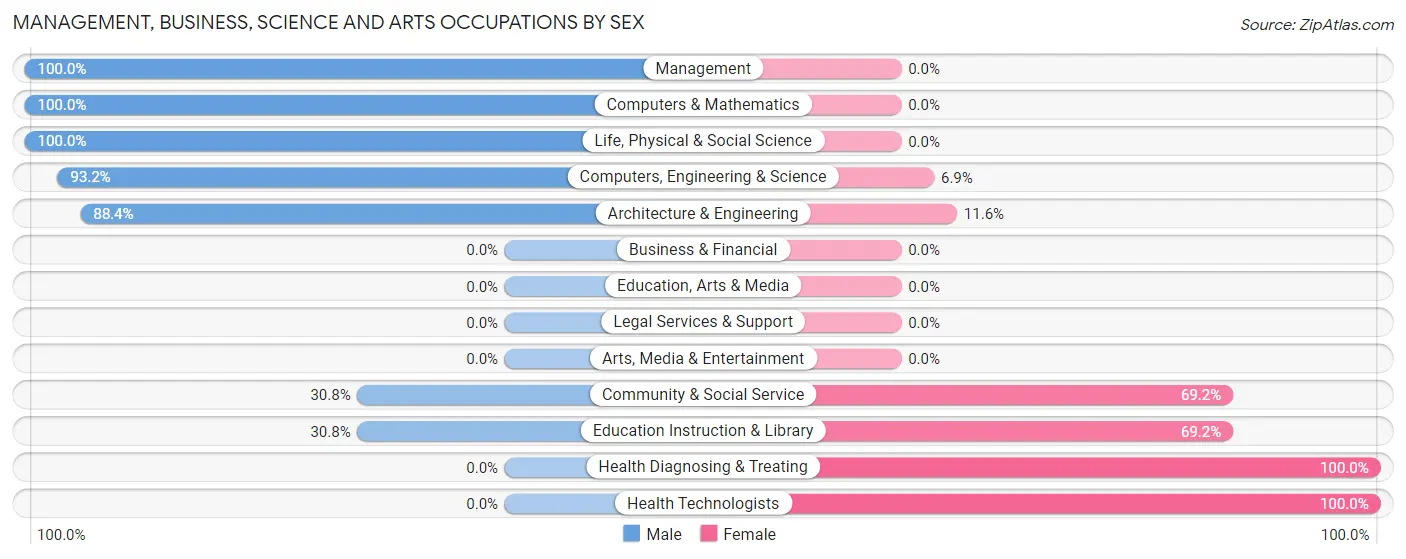
| Occupation | Male | Female |
| Management | 40 (100.0%) | 0 (0.0%) |
| Business & Financial | 0 (0.0%) | 0 (0.0%) |
| Computers, Engineering & Science | 68 (93.1%) | 5 (6.9%) |
| Computers & Mathematics | 13 (100.0%) | 0 (0.0%) |
| Architecture & Engineering | 38 (88.4%) | 5 (11.6%) |
| Life, Physical & Social Science | 17 (100.0%) | 0 (0.0%) |
| Community & Social Service | 8 (30.8%) | 18 (69.2%) |
| Education, Arts & Media | 0 (0.0%) | 0 (0.0%) |
| Legal Services & Support | 0 (0.0%) | 0 (0.0%) |
| Education Instruction & Library | 8 (30.8%) | 18 (69.2%) |
| Arts, Media & Entertainment | 0 (0.0%) | 0 (0.0%) |
| Health Diagnosing & Treating | 0 (0.0%) | 78 (100.0%) |
| Health Technologists | 0 (0.0%) | 33 (100.0%) |
| Total (Category) | 116 (53.5%) | 101 (46.5%) |
| Total (Overall) | 324 (47.0%) | 366 (53.0%) |
Services Occupations
The most common Services occupations in Lockport Heights are Food Preparation & Serving (97 | 14.1%), Healthcare Support (86 | 12.5%), and Cleaning & Maintenance (13 | 1.9%).
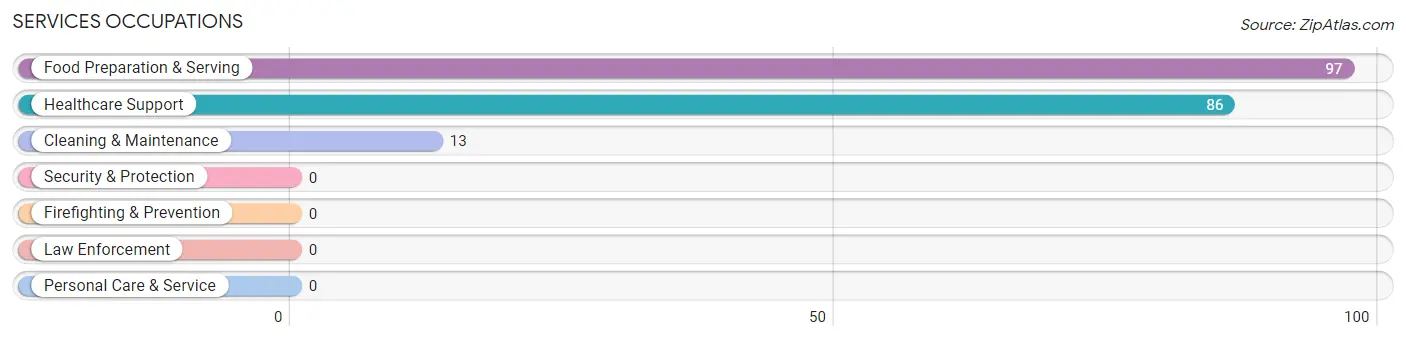
Services Occupations by Sex
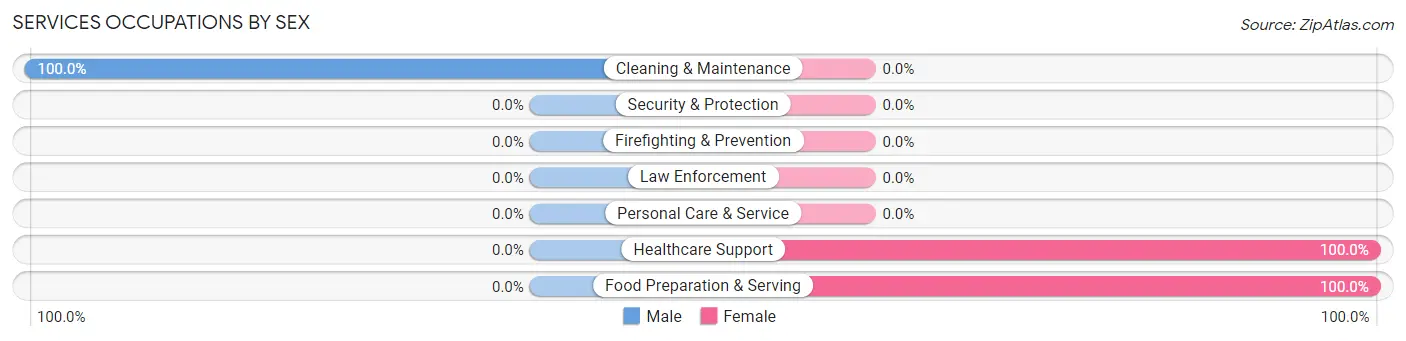
| Occupation | Male | Female |
| Healthcare Support | 0 (0.0%) | 86 (100.0%) |
| Security & Protection | 0 (0.0%) | 0 (0.0%) |
| Firefighting & Prevention | 0 (0.0%) | 0 (0.0%) |
| Law Enforcement | 0 (0.0%) | 0 (0.0%) |
| Food Preparation & Serving | 0 (0.0%) | 97 (100.0%) |
| Cleaning & Maintenance | 13 (100.0%) | 0 (0.0%) |
| Personal Care & Service | 0 (0.0%) | 0 (0.0%) |
| Total (Category) | 13 (6.6%) | 183 (93.4%) |
| Total (Overall) | 324 (47.0%) | 366 (53.0%) |
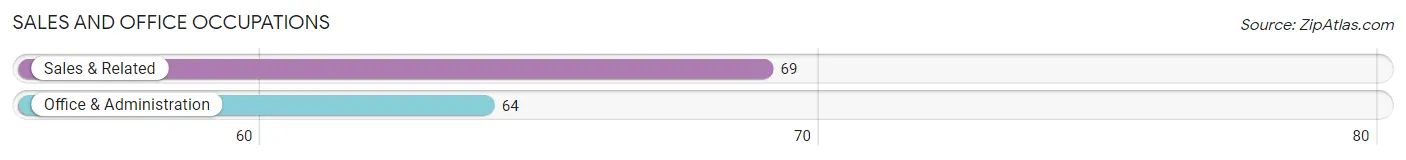
Sales and Office Occupations
The most common Sales and Office occupations in Lockport Heights are Sales & Related (69 | 10.0%), and Office & Administration (64 | 9.3%).
Sales and Office Occupations by Sex
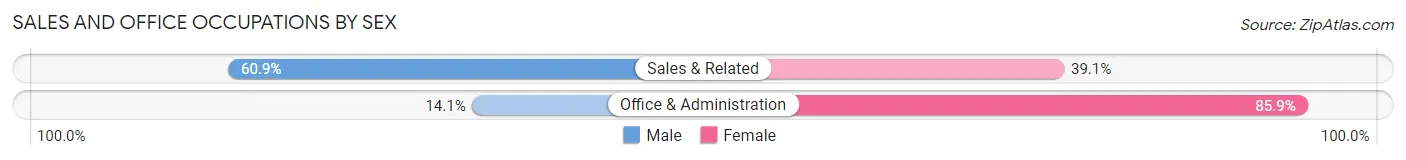
| Occupation | Male | Female |
| Sales & Related | 42 (60.9%) | 27 (39.1%) |
| Office & Administration | 9 (14.1%) | 55 (85.9%) |
| Total (Category) | 51 (38.4%) | 82 (61.7%) |
| Total (Overall) | 324 (47.0%) | 366 (53.0%) |
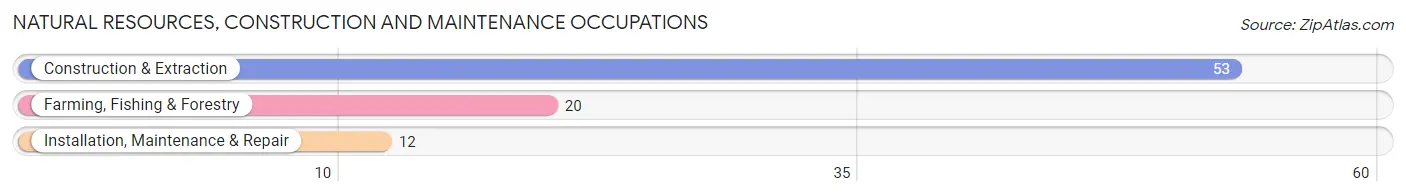
Natural Resources, Construction and Maintenance Occupations
The most common Natural Resources, Construction and Maintenance occupations in Lockport Heights are Construction & Extraction (53 | 7.7%), Farming, Fishing & Forestry (20 | 2.9%), and Installation, Maintenance & Repair (12 | 1.7%).
Natural Resources, Construction and Maintenance Occupations by Sex
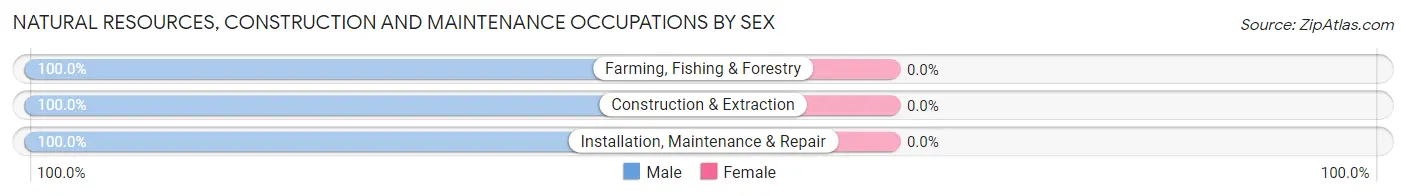
| Occupation | Male | Female |
| Farming, Fishing & Forestry | 20 (100.0%) | 0 (0.0%) |
| Construction & Extraction | 53 (100.0%) | 0 (0.0%) |
| Installation, Maintenance & Repair | 12 (100.0%) | 0 (0.0%) |
| Total (Category) | 85 (100.0%) | 0 (0.0%) |
| Total (Overall) | 324 (47.0%) | 366 (53.0%) |
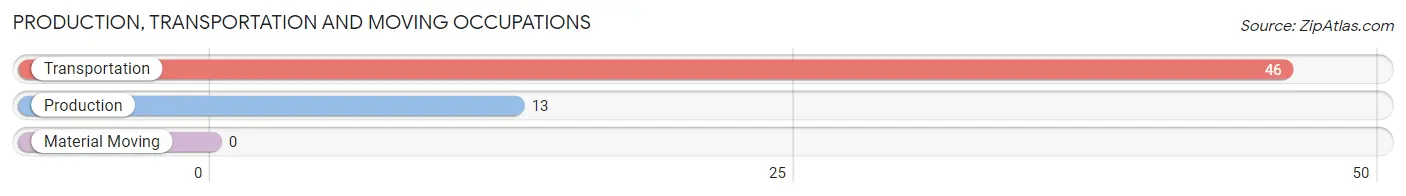
Production, Transportation and Moving Occupations
The most common Production, Transportation and Moving occupations in Lockport Heights are Transportation (46 | 6.7%), and Production (13 | 1.9%).
Production, Transportation and Moving Occupations by Sex
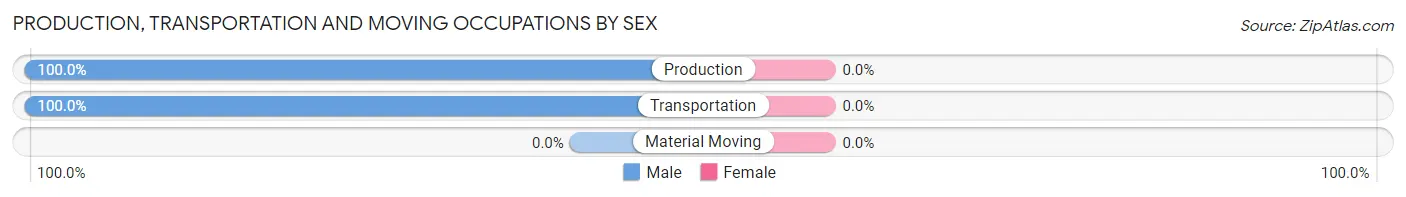
| Occupation | Male | Female |
| Production | 13 (100.0%) | 0 (0.0%) |
| Transportation | 46 (100.0%) | 0 (0.0%) |
| Material Moving | 0 (0.0%) | 0 (0.0%) |
| Total (Category) | 59 (100.0%) | 0 (0.0%) |
| Total (Overall) | 324 (47.0%) | 366 (53.0%) |
Employment Industries by Sex in Lockport Heights
Employment Industries in Lockport Heights
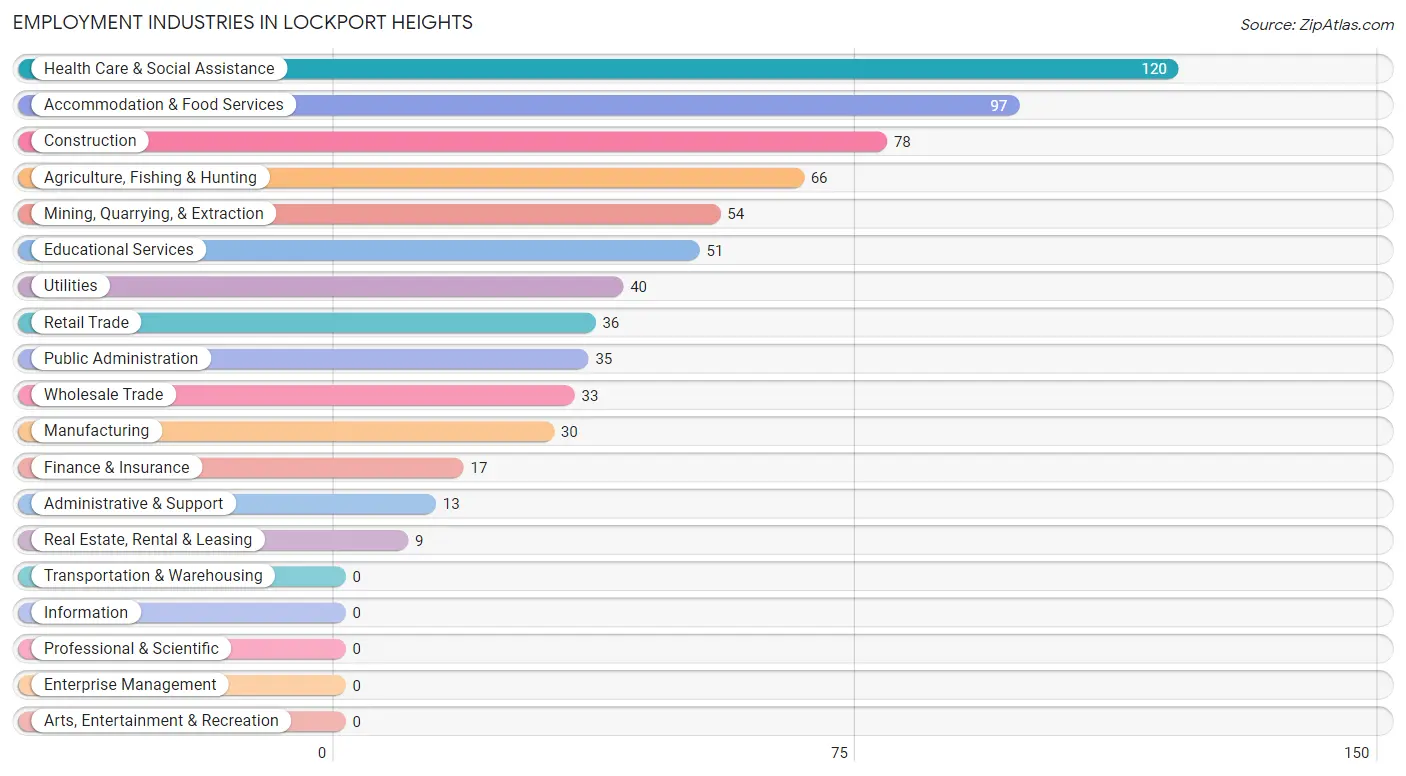
The major employment industries in Lockport Heights include Health Care & Social Assistance (120 | 17.4%), Accommodation & Food Services (97 | 14.1%), Construction (78 | 11.3%), Agriculture, Fishing & Hunting (66 | 9.6%), and Mining, Quarrying, & Extraction (54 | 7.8%).
Employment Industries by Sex in Lockport Heights
The Lockport Heights industries that see more men than women are Agriculture, Fishing & Hunting (100.0%), Manufacturing (100.0%), and Utilities (100.0%), whereas the industries that tend to have a higher number of women are Finance & Insurance (100.0%), Educational Services (100.0%), and Health Care & Social Assistance (100.0%).
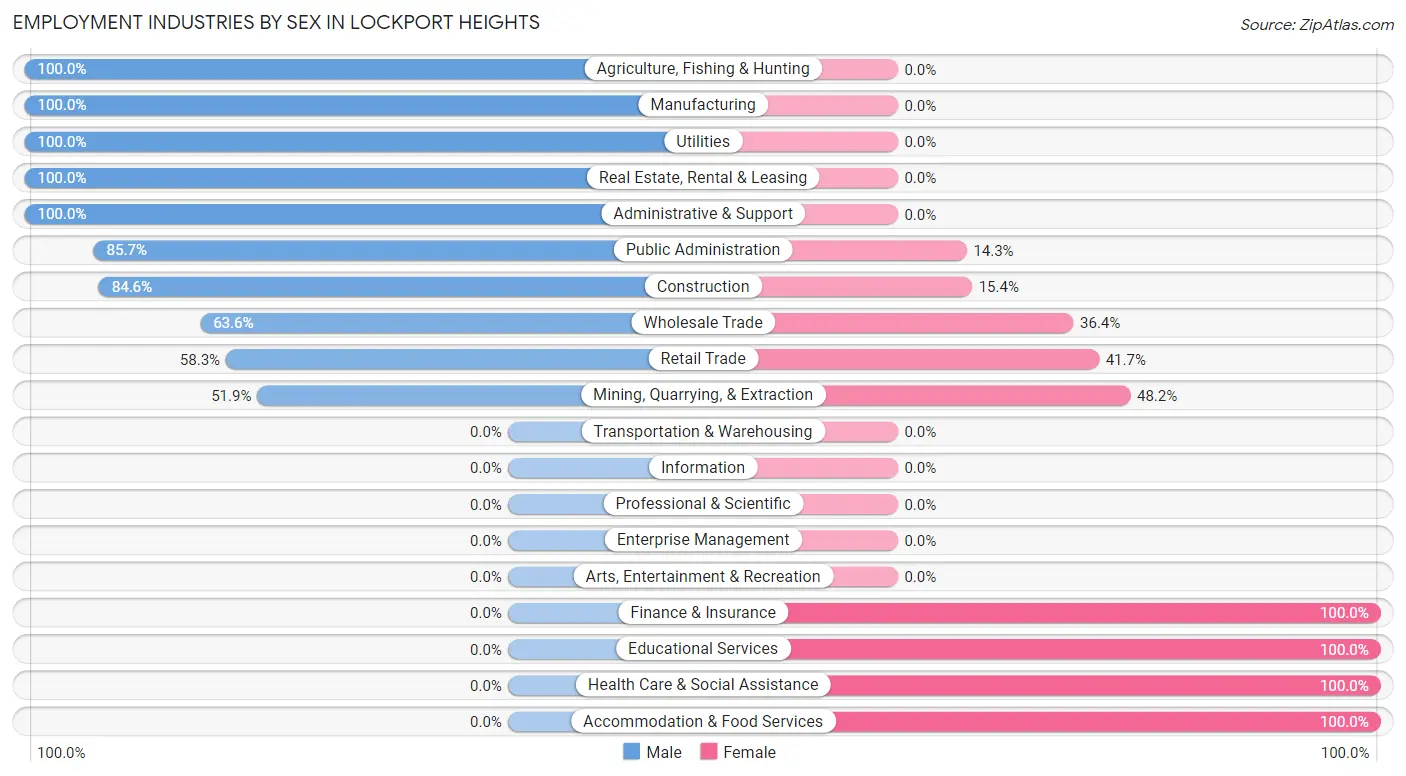
| Industry | Male | Female |
| Agriculture, Fishing & Hunting | 66 (100.0%) | 0 (0.0%) |
| Mining, Quarrying, & Extraction | 28 (51.8%) | 26 (48.1%) |
| Construction | 66 (84.6%) | 12 (15.4%) |
| Manufacturing | 30 (100.0%) | 0 (0.0%) |
| Wholesale Trade | 21 (63.6%) | 12 (36.4%) |
| Retail Trade | 21 (58.3%) | 15 (41.7%) |
| Transportation & Warehousing | 0 (0.0%) | 0 (0.0%) |
| Utilities | 40 (100.0%) | 0 (0.0%) |
| Information | 0 (0.0%) | 0 (0.0%) |
| Finance & Insurance | 0 (0.0%) | 17 (100.0%) |
| Real Estate, Rental & Leasing | 9 (100.0%) | 0 (0.0%) |
| Professional & Scientific | 0 (0.0%) | 0 (0.0%) |
| Enterprise Management | 0 (0.0%) | 0 (0.0%) |
| Administrative & Support | 13 (100.0%) | 0 (0.0%) |
| Educational Services | 0 (0.0%) | 51 (100.0%) |
| Health Care & Social Assistance | 0 (0.0%) | 120 (100.0%) |
| Arts, Entertainment & Recreation | 0 (0.0%) | 0 (0.0%) |
| Accommodation & Food Services | 0 (0.0%) | 97 (100.0%) |
| Public Administration | 30 (85.7%) | 5 (14.3%) |
| Total | 324 (47.0%) | 366 (53.0%) |
Education in Lockport Heights
School Enrollment in Lockport Heights
The most common levels of schooling among the 244 students in Lockport Heights are middle school (88 | 36.1%), high school (74 | 30.3%), and elementary school (67 | 27.5%).
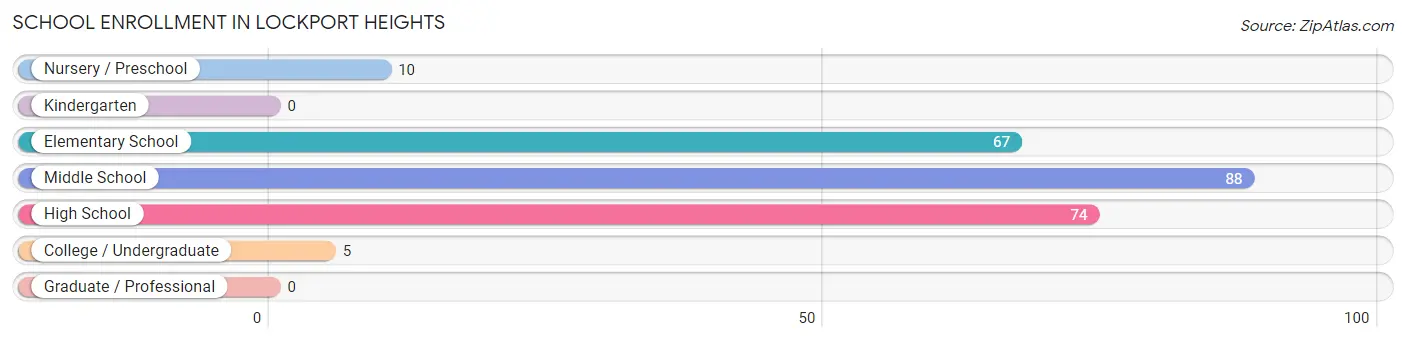
| School Level | # Students | % Students |
| Nursery / Preschool | 10 | 4.1% |
| Kindergarten | 0 | 0.0% |
| Elementary School | 67 | 27.5% |
| Middle School | 88 | 36.1% |
| High School | 74 | 30.3% |
| College / Undergraduate | 5 | 2.1% |
| Graduate / Professional | 0 | 0.0% |
| Total | 244 | 100.0% |
School Enrollment by Age by Funding Source in Lockport Heights
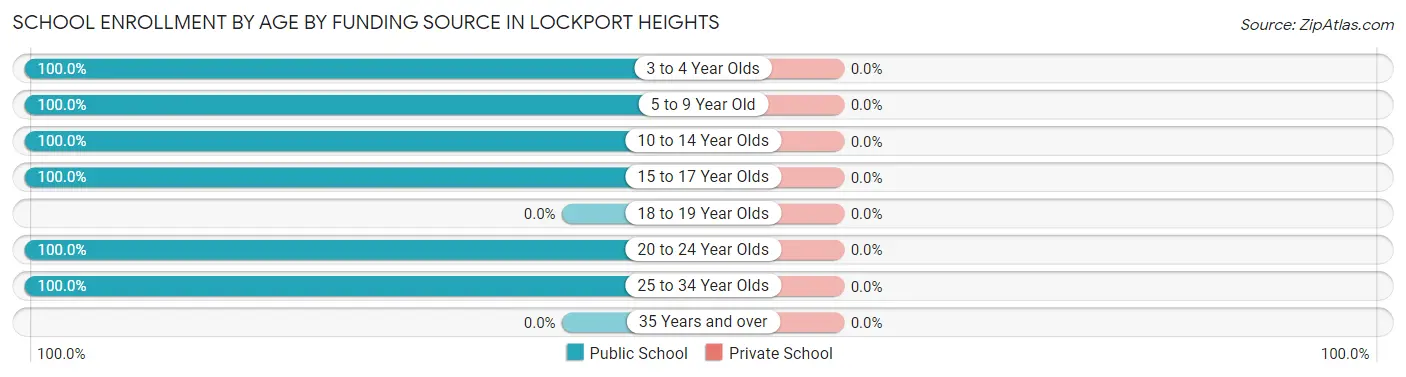
| Age Bracket | Public School | Private School |
| 3 to 4 Year Olds | 10 (100.0%) | 0 (0.0%) |
| 5 to 9 Year Old | 31 (100.0%) | 0 (0.0%) |
| 10 to 14 Year Olds | 136 (100.0%) | 0 (0.0%) |
| 15 to 17 Year Olds | 51 (100.0%) | 0 (0.0%) |
| 18 to 19 Year Olds | 0 (0.0%) | 0 (0.0%) |
| 20 to 24 Year Olds | 5 (100.0%) | 0 (0.0%) |
| 25 to 34 Year Olds | 11 (100.0%) | 0 (0.0%) |
| 35 Years and over | 0 (0.0%) | 0 (0.0%) |
| Total | 244 (100.0%) | 0 (0.0%) |
Educational Attainment by Field of Study in Lockport Heights
Business (96 | 46.6%), education (77 | 37.4%), and science & technology (33 | 16.0%) are the most common fields of study among 206 individuals in Lockport Heights who have obtained a bachelor's degree or higher.
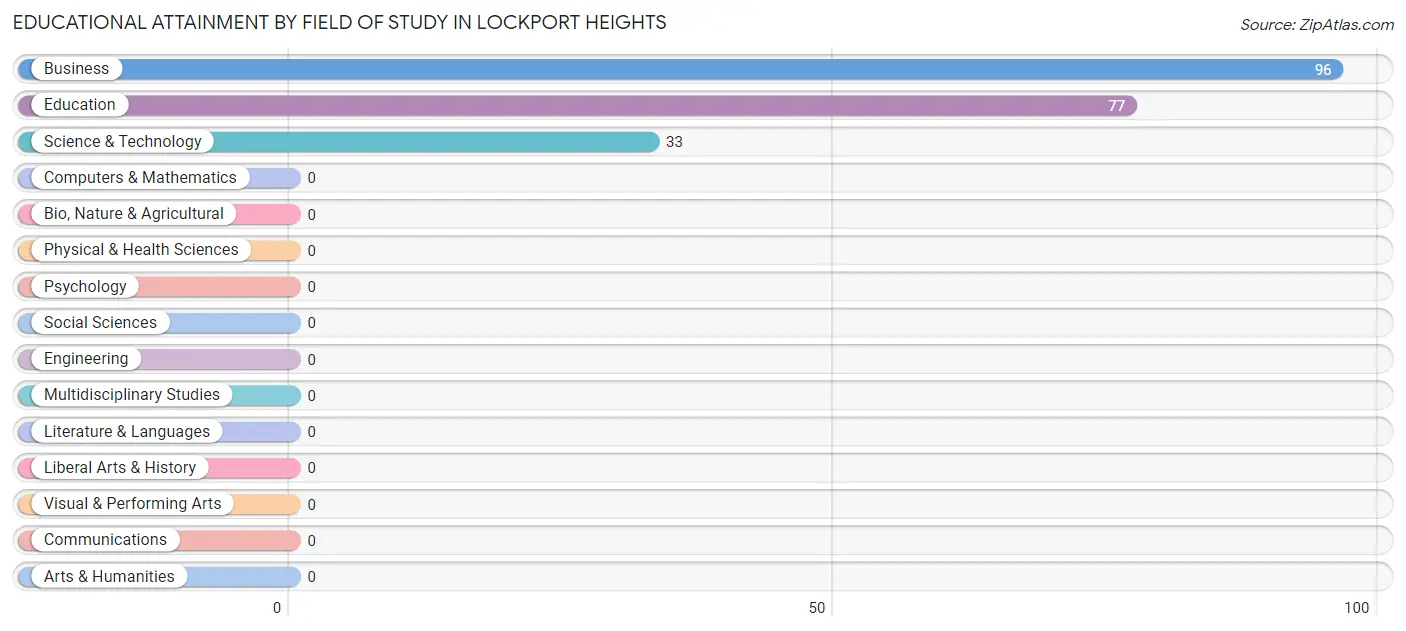
| Field of Study | # Graduates | % Graduates |
| Computers & Mathematics | 0 | 0.0% |
| Bio, Nature & Agricultural | 0 | 0.0% |
| Physical & Health Sciences | 0 | 0.0% |
| Psychology | 0 | 0.0% |
| Social Sciences | 0 | 0.0% |
| Engineering | 0 | 0.0% |
| Multidisciplinary Studies | 0 | 0.0% |
| Science & Technology | 33 | 16.0% |
| Business | 96 | 46.6% |
| Education | 77 | 37.4% |
| Literature & Languages | 0 | 0.0% |
| Liberal Arts & History | 0 | 0.0% |
| Visual & Performing Arts | 0 | 0.0% |
| Communications | 0 | 0.0% |
| Arts & Humanities | 0 | 0.0% |
| Total | 206 | 100.0% |
Transportation & Commute in Lockport Heights
Vehicle Availability by Sex in Lockport Heights
The most prevalent vehicle ownership categories in Lockport Heights are males with 2 vehicles (106, accounting for 32.7%) and females with 2 vehicles (29, making up 29.0%).
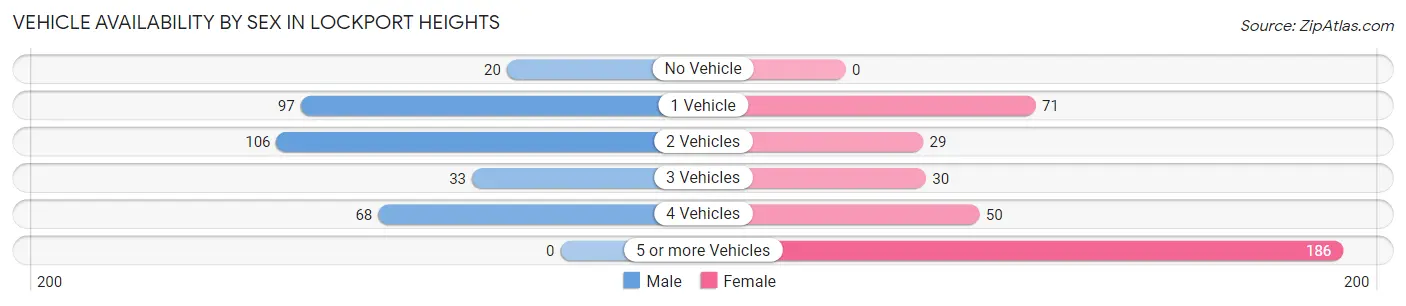
| Vehicles Available | Male | Female |
| No Vehicle | 20 (6.2%) | 0 (0.0%) |
| 1 Vehicle | 97 (29.9%) | 71 (19.4%) |
| 2 Vehicles | 106 (32.7%) | 29 (7.9%) |
| 3 Vehicles | 33 (10.2%) | 30 (8.2%) |
| 4 Vehicles | 68 (21.0%) | 50 (13.7%) |
| 5 or more Vehicles | 0 (0.0%) | 186 (50.8%) |
| Total | 324 (100.0%) | 366 (100.0%) |
Commute Time in Lockport Heights
The most frequently occuring commute durations in Lockport Heights are 25 to 29 minutes (116 commuters, 17.8%), 45 to 59 minutes (89 commuters, 13.7%), and 5 to 9 minutes (72 commuters, 11.0%).
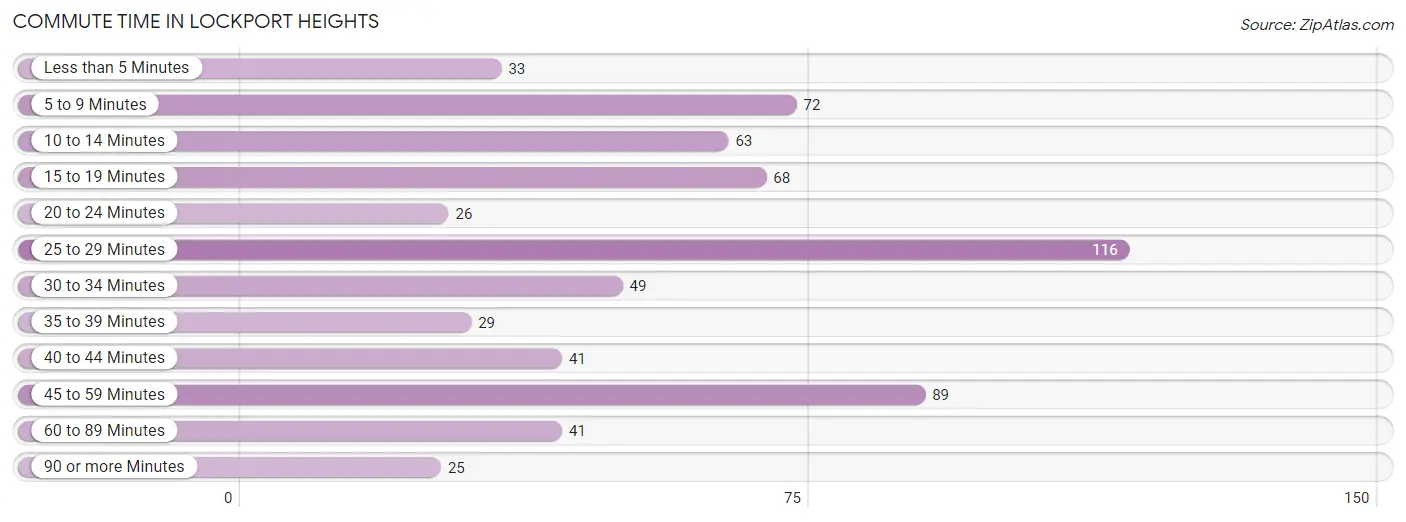
| Commute Time | # Commuters | % Commuters |
| Less than 5 Minutes | 33 | 5.1% |
| 5 to 9 Minutes | 72 | 11.0% |
| 10 to 14 Minutes | 63 | 9.7% |
| 15 to 19 Minutes | 68 | 10.4% |
| 20 to 24 Minutes | 26 | 4.0% |
| 25 to 29 Minutes | 116 | 17.8% |
| 30 to 34 Minutes | 49 | 7.5% |
| 35 to 39 Minutes | 29 | 4.4% |
| 40 to 44 Minutes | 41 | 6.3% |
| 45 to 59 Minutes | 89 | 13.7% |
| 60 to 89 Minutes | 41 | 6.3% |
| 90 or more Minutes | 25 | 3.8% |
Commute Time by Sex in Lockport Heights
The most common commute times in Lockport Heights are 25 to 29 minutes (59 commuters, 19.9%) for males and 45 to 59 minutes (84 commuters, 23.7%) for females.
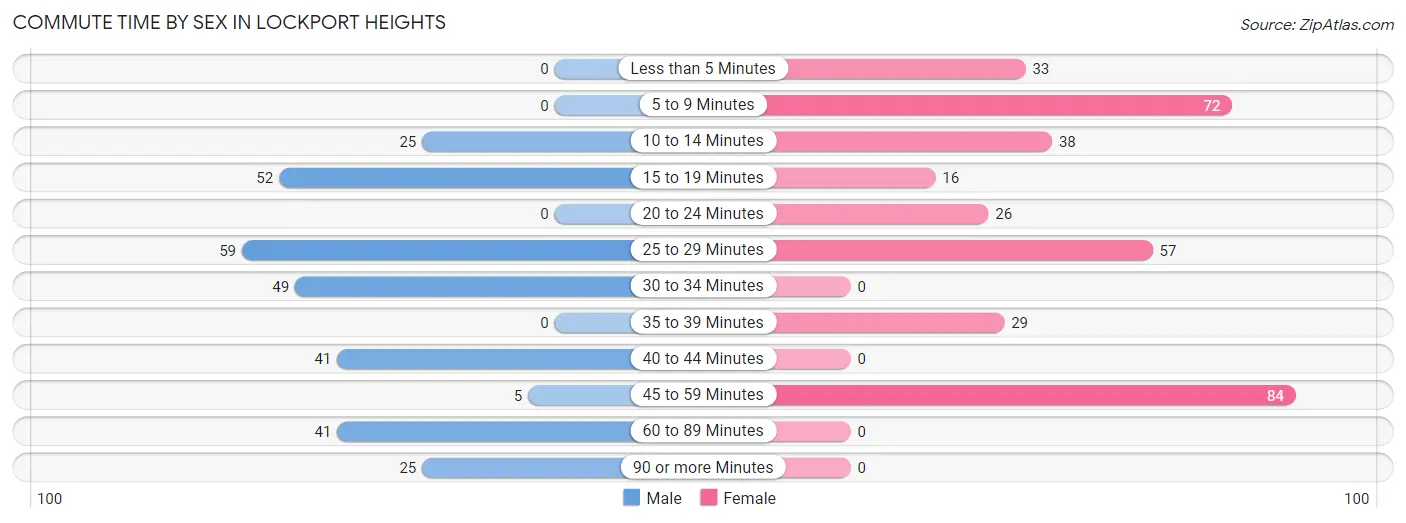
| Commute Time | Male | Female |
| Less than 5 Minutes | 0 (0.0%) | 33 (9.3%) |
| 5 to 9 Minutes | 0 (0.0%) | 72 (20.3%) |
| 10 to 14 Minutes | 25 (8.4%) | 38 (10.7%) |
| 15 to 19 Minutes | 52 (17.5%) | 16 (4.5%) |
| 20 to 24 Minutes | 0 (0.0%) | 26 (7.3%) |
| 25 to 29 Minutes | 59 (19.9%) | 57 (16.1%) |
| 30 to 34 Minutes | 49 (16.5%) | 0 (0.0%) |
| 35 to 39 Minutes | 0 (0.0%) | 29 (8.2%) |
| 40 to 44 Minutes | 41 (13.8%) | 0 (0.0%) |
| 45 to 59 Minutes | 5 (1.7%) | 84 (23.7%) |
| 60 to 89 Minutes | 41 (13.8%) | 0 (0.0%) |
| 90 or more Minutes | 25 (8.4%) | 0 (0.0%) |
Time of Departure to Work by Sex in Lockport Heights
The most frequent times of departure to work in Lockport Heights are 6:00 AM to 6:29 AM (122, 41.1%) for males and 5:00 AM to 5:29 AM (141, 39.7%) for females.
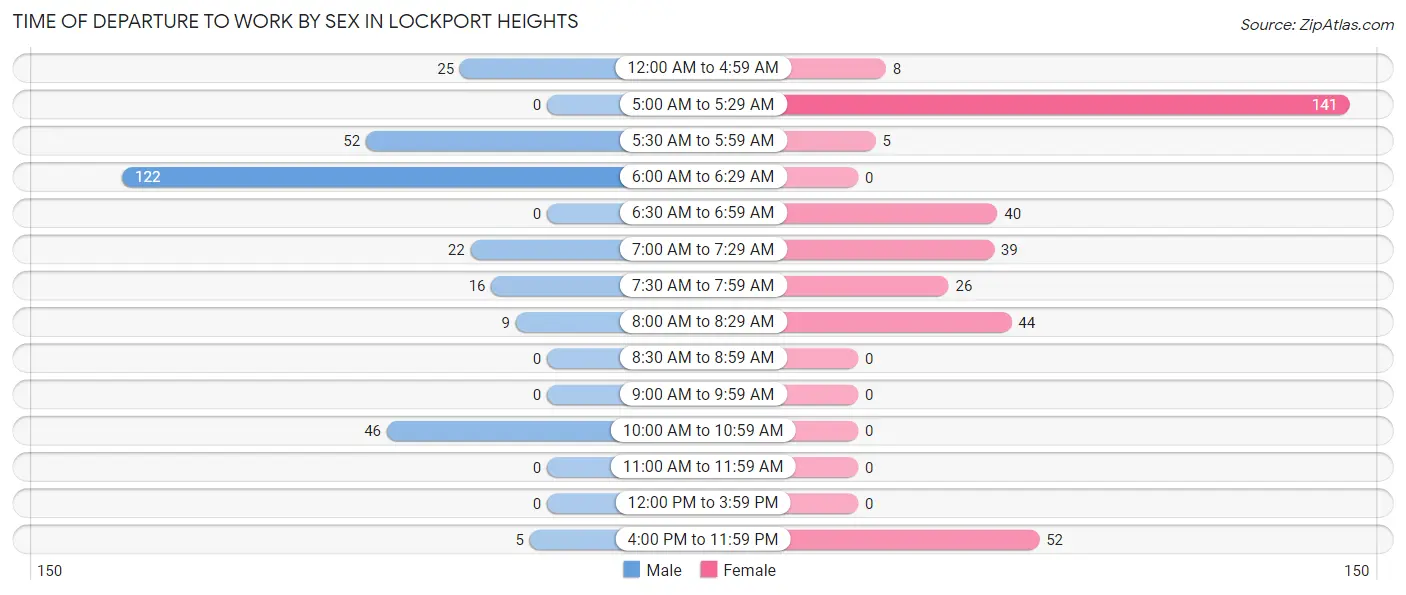
| Time of Departure | Male | Female |
| 12:00 AM to 4:59 AM | 25 (8.4%) | 8 (2.2%) |
| 5:00 AM to 5:29 AM | 0 (0.0%) | 141 (39.7%) |
| 5:30 AM to 5:59 AM | 52 (17.5%) | 5 (1.4%) |
| 6:00 AM to 6:29 AM | 122 (41.1%) | 0 (0.0%) |
| 6:30 AM to 6:59 AM | 0 (0.0%) | 40 (11.3%) |
| 7:00 AM to 7:29 AM | 22 (7.4%) | 39 (11.0%) |
| 7:30 AM to 7:59 AM | 16 (5.4%) | 26 (7.3%) |
| 8:00 AM to 8:29 AM | 9 (3.0%) | 44 (12.4%) |
| 8:30 AM to 8:59 AM | 0 (0.0%) | 0 (0.0%) |
| 9:00 AM to 9:59 AM | 0 (0.0%) | 0 (0.0%) |
| 10:00 AM to 10:59 AM | 46 (15.5%) | 0 (0.0%) |
| 11:00 AM to 11:59 AM | 0 (0.0%) | 0 (0.0%) |
| 12:00 PM to 3:59 PM | 0 (0.0%) | 0 (0.0%) |
| 4:00 PM to 11:59 PM | 5 (1.7%) | 52 (14.6%) |
| Total | 297 (100.0%) | 355 (100.0%) |
Housing Occupancy in Lockport Heights
Occupancy by Ownership in Lockport Heights
Of the total 550 dwellings in Lockport Heights, owner-occupied units account for 385 (70.0%), while renter-occupied units make up 165 (30.0%).
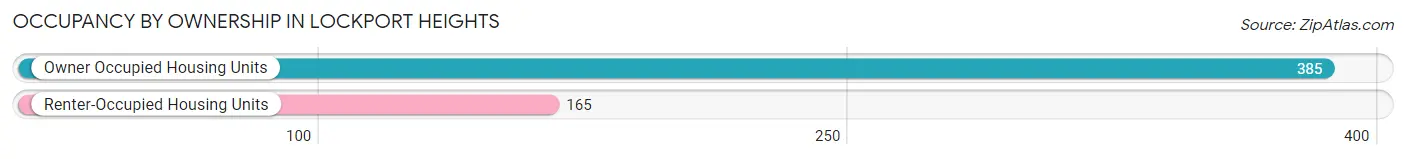
| Occupancy | # Housing Units | % Housing Units |
| Owner Occupied Housing Units | 385 | 70.0% |
| Renter-Occupied Housing Units | 165 | 30.0% |
| Total Occupied Housing Units | 550 | 100.0% |
Occupancy by Household Size in Lockport Heights
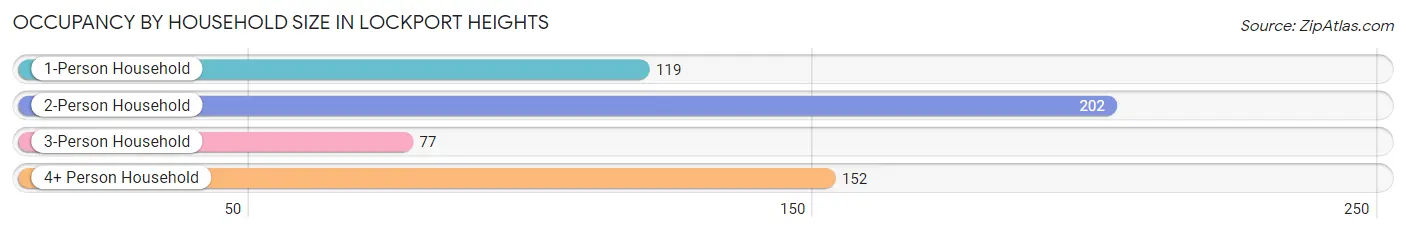
| Household Size | # Housing Units | % Housing Units |
| 1-Person Household | 119 | 21.6% |
| 2-Person Household | 202 | 36.7% |
| 3-Person Household | 77 | 14.0% |
| 4+ Person Household | 152 | 27.6% |
| Total Housing Units | 550 | 100.0% |
Occupancy by Ownership by Household Size in Lockport Heights
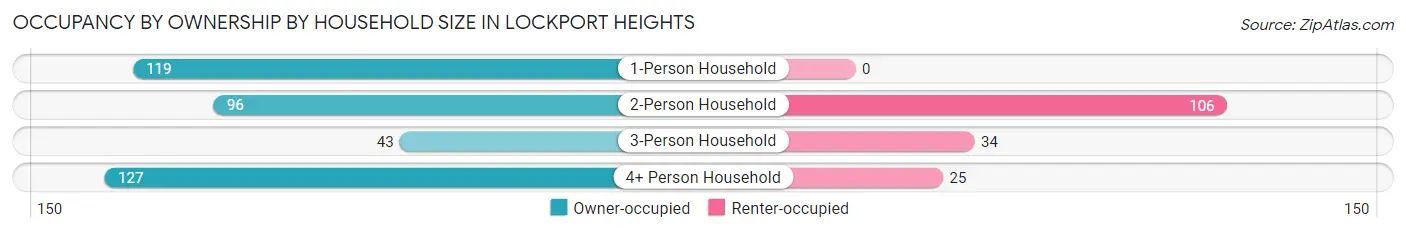
| Household Size | Owner-occupied | Renter-occupied |
| 1-Person Household | 119 (100.0%) | 0 (0.0%) |
| 2-Person Household | 96 (47.5%) | 106 (52.5%) |
| 3-Person Household | 43 (55.8%) | 34 (44.2%) |
| 4+ Person Household | 127 (83.6%) | 25 (16.5%) |
| Total Housing Units | 385 (70.0%) | 165 (30.0%) |
Occupancy by Educational Attainment in Lockport Heights
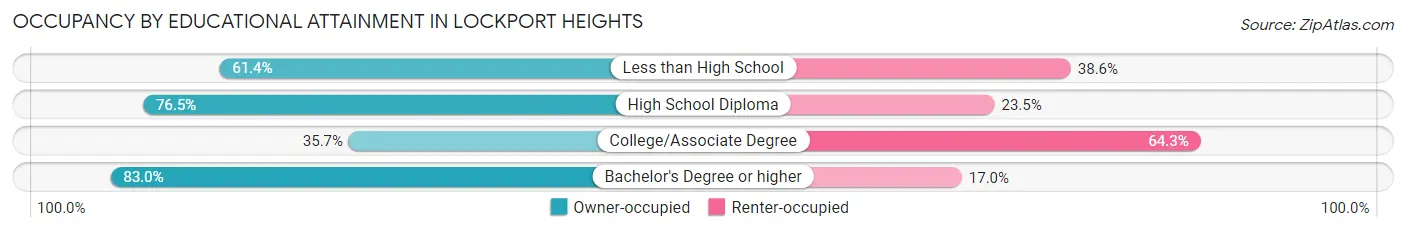
| Household Size | Owner-occupied | Renter-occupied |
| Less than High School | 70 (61.4%) | 44 (38.6%) |
| High School Diploma | 163 (76.5%) | 50 (23.5%) |
| College/Associate Degree | 25 (35.7%) | 45 (64.3%) |
| Bachelor's Degree or higher | 127 (83.0%) | 26 (17.0%) |
Occupancy by Age of Householder in Lockport Heights
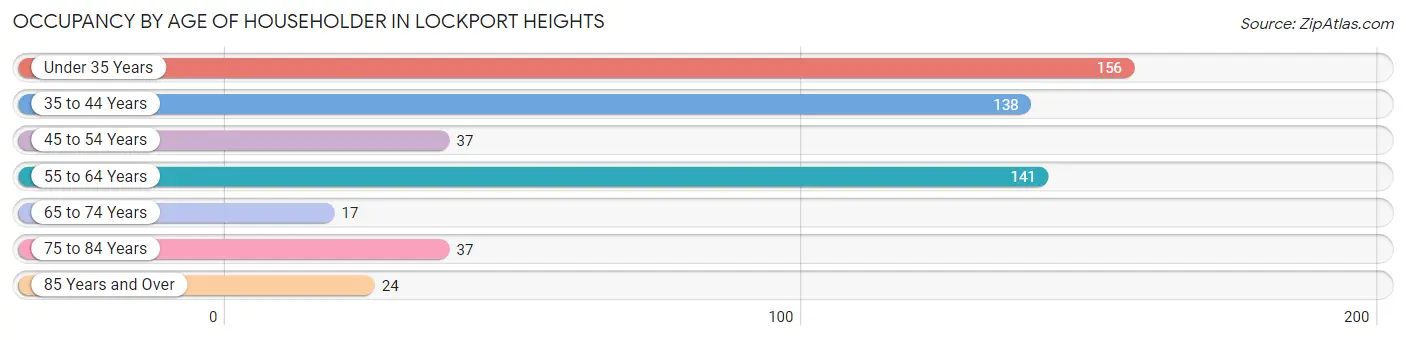
| Age Bracket | # Households | % Households |
| Under 35 Years | 156 | 28.4% |
| 35 to 44 Years | 138 | 25.1% |
| 45 to 54 Years | 37 | 6.7% |
| 55 to 64 Years | 141 | 25.6% |
| 65 to 74 Years | 17 | 3.1% |
| 75 to 84 Years | 37 | 6.7% |
| 85 Years and Over | 24 | 4.4% |
| Total | 550 | 100.0% |
Housing Finances in Lockport Heights
Median Income by Occupancy in Lockport Heights
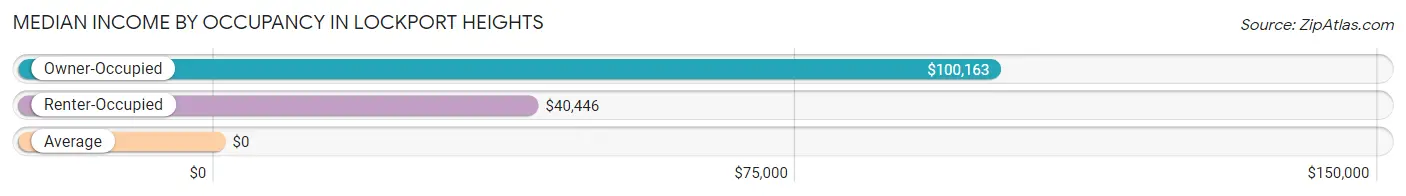
| Occupancy Type | # Households | Median Income |
| Owner-Occupied | 385 (70.0%) | $100,163 |
| Renter-Occupied | 165 (30.0%) | $40,446 |
| Average | 550 (100.0%) | $0 |
Occupancy by Householder Income Bracket in Lockport Heights
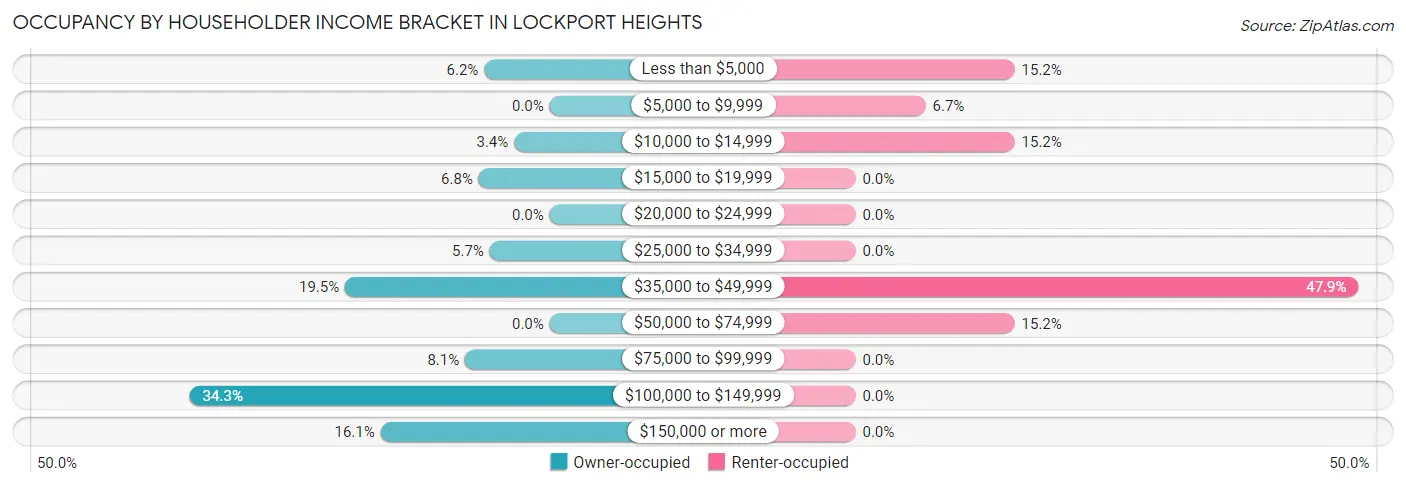
| Income Bracket | Owner-occupied | Renter-occupied |
| Less than $5,000 | 24 (6.2%) | 25 (15.1%) |
| $5,000 to $9,999 | 0 (0.0%) | 11 (6.7%) |
| $10,000 to $14,999 | 13 (3.4%) | 25 (15.1%) |
| $15,000 to $19,999 | 26 (6.8%) | 0 (0.0%) |
| $20,000 to $24,999 | 0 (0.0%) | 0 (0.0%) |
| $25,000 to $34,999 | 22 (5.7%) | 0 (0.0%) |
| $35,000 to $49,999 | 75 (19.5%) | 79 (47.9%) |
| $50,000 to $74,999 | 0 (0.0%) | 25 (15.1%) |
| $75,000 to $99,999 | 31 (8.1%) | 0 (0.0%) |
| $100,000 to $149,999 | 132 (34.3%) | 0 (0.0%) |
| $150,000 or more | 62 (16.1%) | 0 (0.0%) |
| Total | 385 (100.0%) | 165 (100.0%) |
Monthly Housing Cost Tiers in Lockport Heights
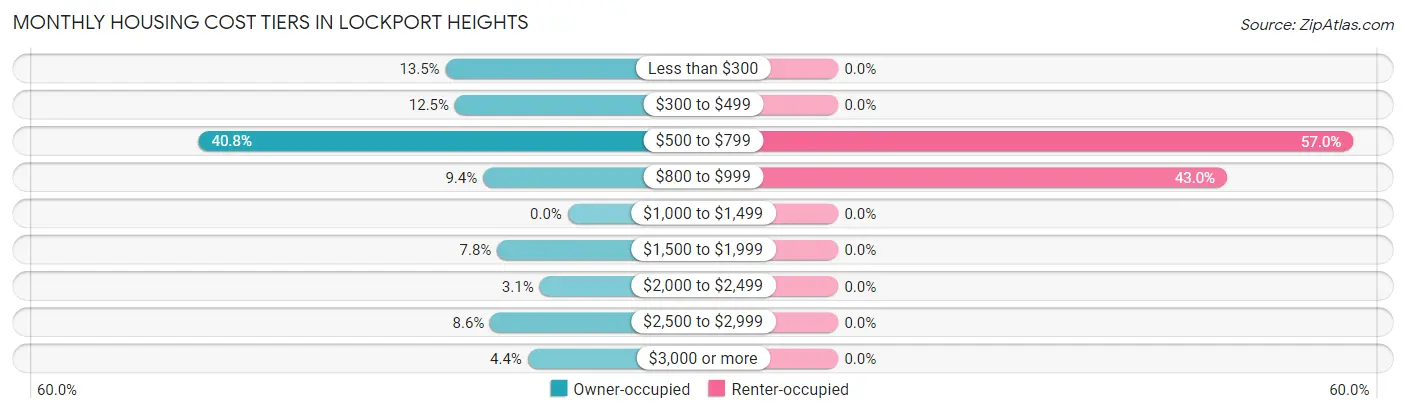
| Monthly Cost | Owner-occupied | Renter-occupied |
| Less than $300 | 52 (13.5%) | 0 (0.0%) |
| $300 to $499 | 48 (12.5%) | 0 (0.0%) |
| $500 to $799 | 157 (40.8%) | 94 (57.0%) |
| $800 to $999 | 36 (9.3%) | 71 (43.0%) |
| $1,000 to $1,499 | 0 (0.0%) | 0 (0.0%) |
| $1,500 to $1,999 | 30 (7.8%) | 0 (0.0%) |
| $2,000 to $2,499 | 12 (3.1%) | 0 (0.0%) |
| $2,500 to $2,999 | 33 (8.6%) | 0 (0.0%) |
| $3,000 or more | 17 (4.4%) | 0 (0.0%) |
| Total | 385 (100.0%) | 165 (100.0%) |
Physical Housing Characteristics in Lockport Heights
Housing Structures in Lockport Heights
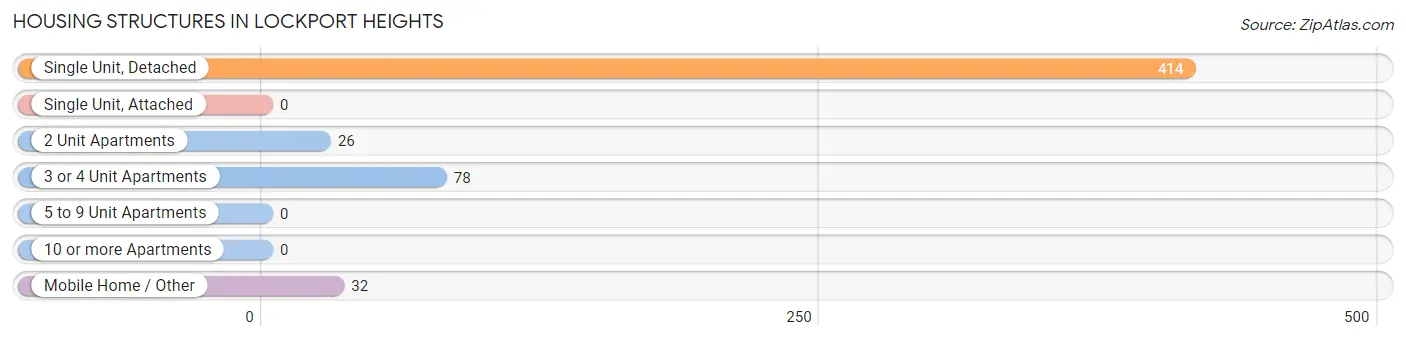
| Structure Type | # Housing Units | % Housing Units |
| Single Unit, Detached | 414 | 75.3% |
| Single Unit, Attached | 0 | 0.0% |
| 2 Unit Apartments | 26 | 4.7% |
| 3 or 4 Unit Apartments | 78 | 14.2% |
| 5 to 9 Unit Apartments | 0 | 0.0% |
| 10 or more Apartments | 0 | 0.0% |
| Mobile Home / Other | 32 | 5.8% |
| Total | 550 | 100.0% |
Housing Structures by Occupancy in Lockport Heights
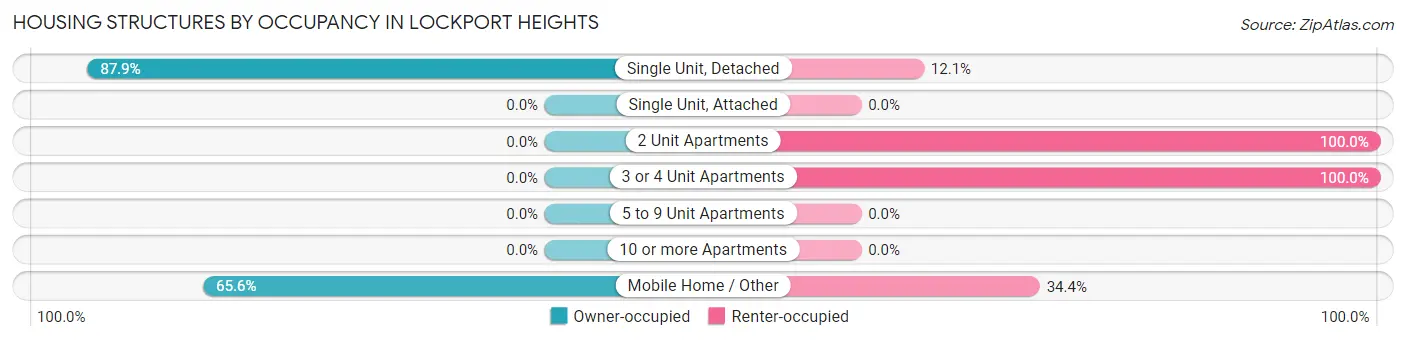
| Structure Type | Owner-occupied | Renter-occupied |
| Single Unit, Detached | 364 (87.9%) | 50 (12.1%) |
| Single Unit, Attached | 0 (0.0%) | 0 (0.0%) |
| 2 Unit Apartments | 0 (0.0%) | 26 (100.0%) |
| 3 or 4 Unit Apartments | 0 (0.0%) | 78 (100.0%) |
| 5 to 9 Unit Apartments | 0 (0.0%) | 0 (0.0%) |
| 10 or more Apartments | 0 (0.0%) | 0 (0.0%) |
| Mobile Home / Other | 21 (65.6%) | 11 (34.4%) |
| Total | 385 (70.0%) | 165 (30.0%) |
Housing Structures by Number of Rooms in Lockport Heights
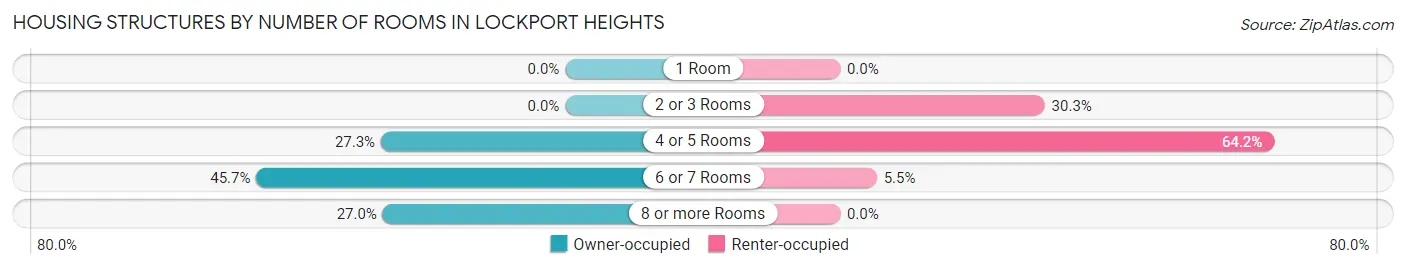
| Number of Rooms | Owner-occupied | Renter-occupied |
| 1 Room | 0 (0.0%) | 0 (0.0%) |
| 2 or 3 Rooms | 0 (0.0%) | 50 (30.3%) |
| 4 or 5 Rooms | 105 (27.3%) | 106 (64.2%) |
| 6 or 7 Rooms | 176 (45.7%) | 9 (5.4%) |
| 8 or more Rooms | 104 (27.0%) | 0 (0.0%) |
| Total | 385 (100.0%) | 165 (100.0%) |
Housing Structure by Heating Type in Lockport Heights

| Heating Type | Owner-occupied | Renter-occupied |
| Utility Gas | 292 (75.8%) | 5 (3.0%) |
| Bottled, Tank, or LP Gas | 0 (0.0%) | 0 (0.0%) |
| Electricity | 93 (24.2%) | 135 (81.8%) |
| Fuel Oil or Kerosene | 0 (0.0%) | 0 (0.0%) |
| Coal or Coke | 0 (0.0%) | 0 (0.0%) |
| All other Fuels | 0 (0.0%) | 0 (0.0%) |
| No Fuel Used | 0 (0.0%) | 25 (15.1%) |
| Total | 385 (100.0%) | 165 (100.0%) |
Household Vehicle Usage in Lockport Heights
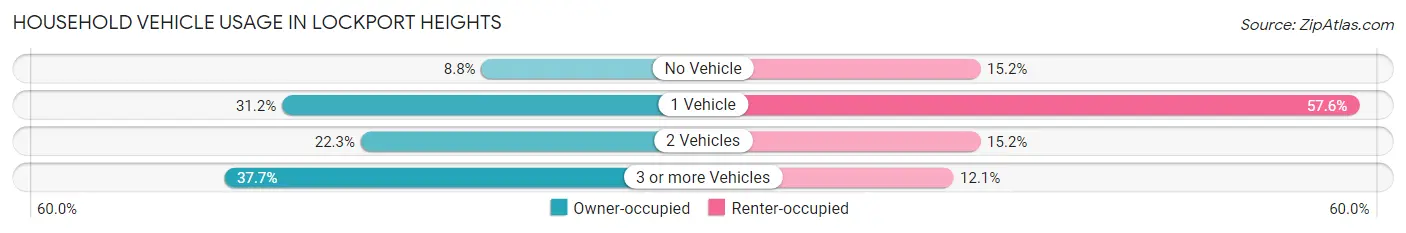
| Vehicles per Household | Owner-occupied | Renter-occupied |
| No Vehicle | 34 (8.8%) | 25 (15.1%) |
| 1 Vehicle | 120 (31.2%) | 95 (57.6%) |
| 2 Vehicles | 86 (22.3%) | 25 (15.1%) |
| 3 or more Vehicles | 145 (37.7%) | 20 (12.1%) |
| Total | 385 (100.0%) | 165 (100.0%) |
Real Estate & Mortgages in Lockport Heights
Real Estate and Mortgage Overview in Lockport Heights
| Characteristic | Without Mortgage | With Mortgage |
| Housing Units | 260 | 125 |
| Median Property Value | $273,800 | $236,700 |
| Median Household Income | - | - |
| Monthly Housing Costs | $605 | $17 |
| Real Estate Taxes | $582 | $10 |
Property Value by Mortgage Status in Lockport Heights
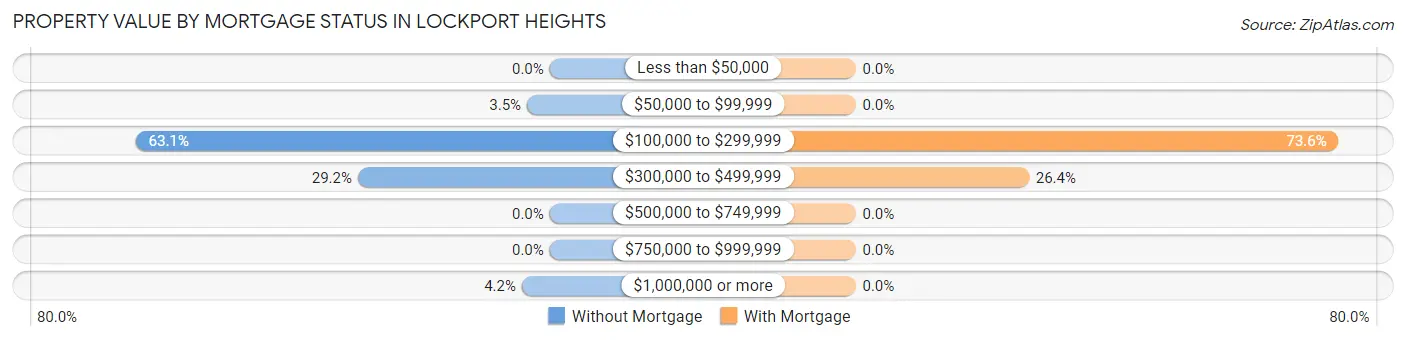
| Property Value | Without Mortgage | With Mortgage |
| Less than $50,000 | 0 (0.0%) | 0 (0.0%) |
| $50,000 to $99,999 | 9 (3.5%) | 0 (0.0%) |
| $100,000 to $299,999 | 164 (63.1%) | 92 (73.6%) |
| $300,000 to $499,999 | 76 (29.2%) | 33 (26.4%) |
| $500,000 to $749,999 | 0 (0.0%) | 0 (0.0%) |
| $750,000 to $999,999 | 0 (0.0%) | 0 (0.0%) |
| $1,000,000 or more | 11 (4.2%) | 0 (0.0%) |
| Total | 260 (100.0%) | 125 (100.0%) |
Household Income by Mortgage Status in Lockport Heights
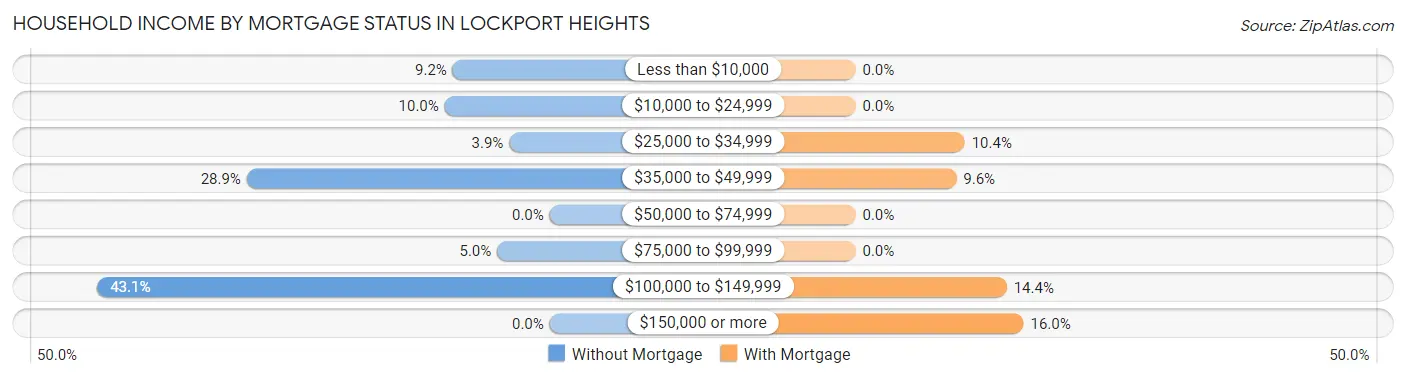
| Household Income | Without Mortgage | With Mortgage |
| Less than $10,000 | 24 (9.2%) | 0 (0.0%) |
| $10,000 to $24,999 | 26 (10.0%) | 0 (0.0%) |
| $25,000 to $34,999 | 10 (3.8%) | 13 (10.4%) |
| $35,000 to $49,999 | 75 (28.8%) | 12 (9.6%) |
| $50,000 to $74,999 | 0 (0.0%) | 0 (0.0%) |
| $75,000 to $99,999 | 13 (5.0%) | 0 (0.0%) |
| $100,000 to $149,999 | 112 (43.1%) | 18 (14.4%) |
| $150,000 or more | 0 (0.0%) | 20 (16.0%) |
| Total | 260 (100.0%) | 125 (100.0%) |
Property Value to Household Income Ratio in Lockport Heights
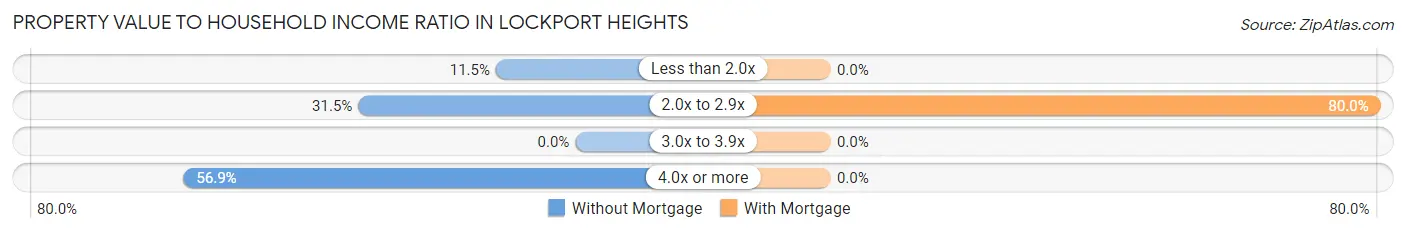
| Value-to-Income Ratio | Without Mortgage | With Mortgage |
| Less than 2.0x | 30 (11.5%) | 0 (0.0%) |
| 2.0x to 2.9x | 82 (31.5%) | 100 (80.0%) |
| 3.0x to 3.9x | 0 (0.0%) | 0 (0.0%) |
| 4.0x or more | 148 (56.9%) | 0 (0.0%) |
| Total | 260 (100.0%) | 125 (100.0%) |
Real Estate Taxes by Mortgage Status in Lockport Heights
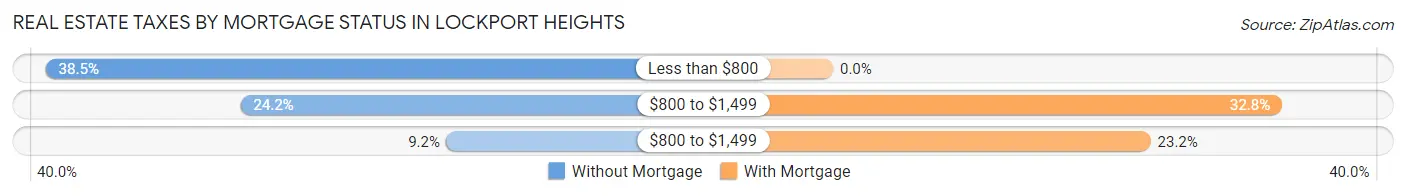
| Property Taxes | Without Mortgage | With Mortgage |
| Less than $800 | 100 (38.5%) | 0 (0.0%) |
| $800 to $1,499 | 63 (24.2%) | 41 (32.8%) |
| $800 to $1,499 | 24 (9.2%) | 29 (23.2%) |
| Total | 260 (100.0%) | 125 (100.0%) |
Health & Disability in Lockport Heights
Health Insurance Coverage by Age in Lockport Heights
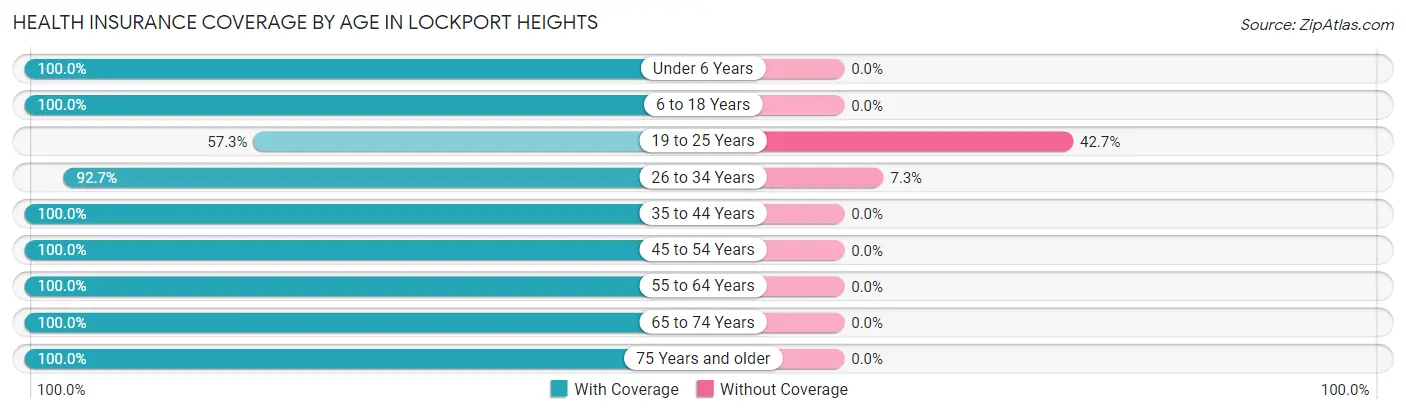
| Age Bracket | With Coverage | Without Coverage |
| Under 6 Years | 68 (100.0%) | 0 (0.0%) |
| 6 to 18 Years | 228 (100.0%) | 0 (0.0%) |
| 19 to 25 Years | 207 (57.3%) | 154 (42.7%) |
| 26 to 34 Years | 140 (92.7%) | 11 (7.3%) |
| 35 to 44 Years | 243 (100.0%) | 0 (0.0%) |
| 45 to 54 Years | 126 (100.0%) | 0 (0.0%) |
| 55 to 64 Years | 181 (100.0%) | 0 (0.0%) |
| 65 to 74 Years | 26 (100.0%) | 0 (0.0%) |
| 75 Years and older | 89 (100.0%) | 0 (0.0%) |
| Total | 1,308 (88.8%) | 165 (11.2%) |
Health Insurance Coverage by Citizenship Status in Lockport Heights
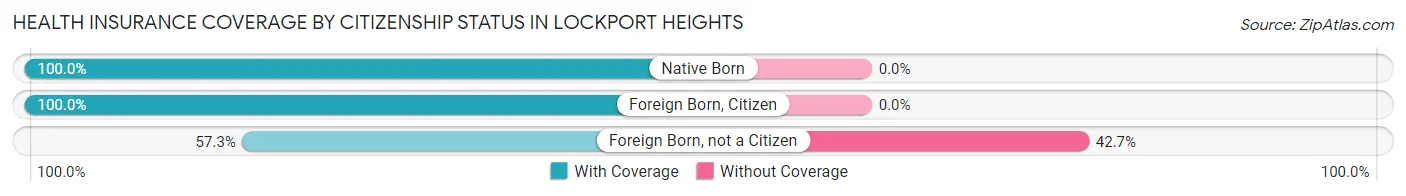
| Citizenship Status | With Coverage | Without Coverage |
| Native Born | 68 (100.0%) | 0 (0.0%) |
| Foreign Born, Citizen | 228 (100.0%) | 0 (0.0%) |
| Foreign Born, not a Citizen | 207 (57.3%) | 154 (42.7%) |
Health Insurance Coverage by Household Income in Lockport Heights
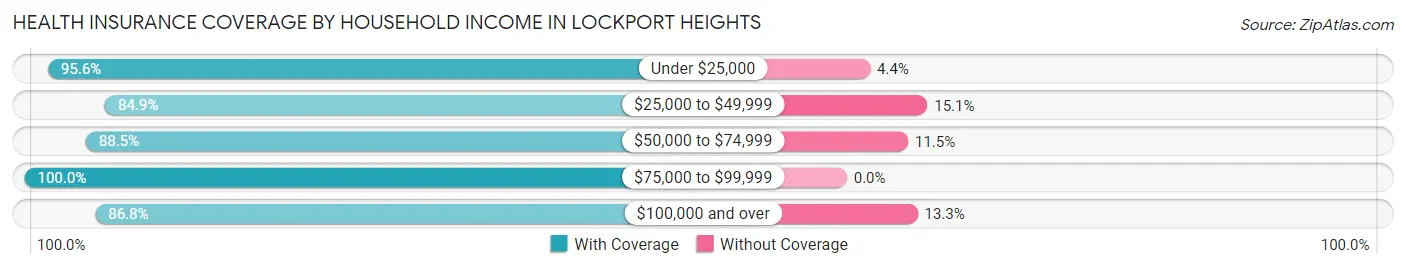
| Household Income | With Coverage | Without Coverage |
| Under $25,000 | 241 (95.6%) | 11 (4.4%) |
| $25,000 to $49,999 | 304 (84.9%) | 54 (15.1%) |
| $50,000 to $74,999 | 54 (88.5%) | 7 (11.5%) |
| $75,000 to $99,999 | 100 (100.0%) | 0 (0.0%) |
| $100,000 and over | 609 (86.8%) | 93 (13.3%) |
Public vs Private Health Insurance Coverage by Age in Lockport Heights
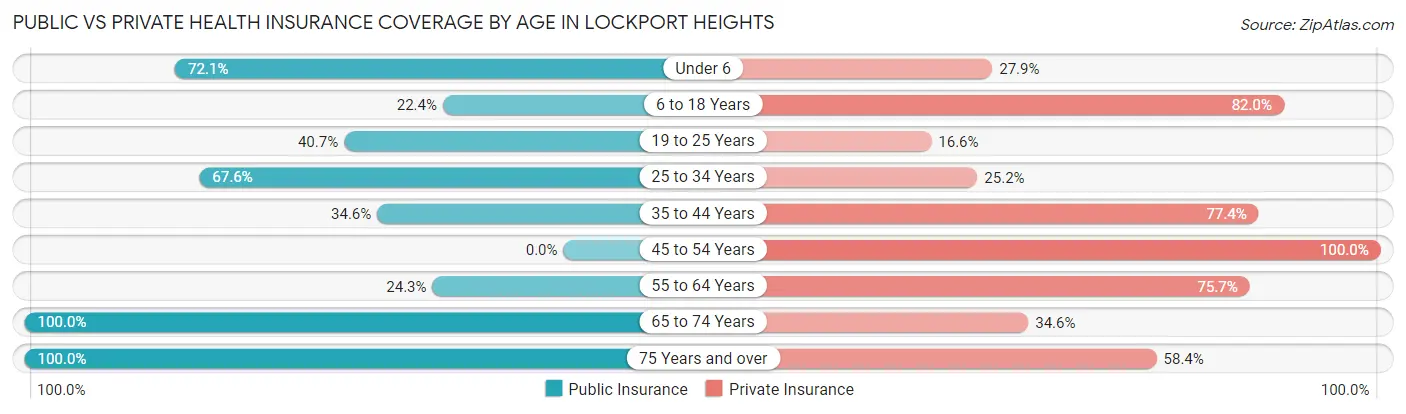
| Age Bracket | Public Insurance | Private Insurance |
| Under 6 | 49 (72.1%) | 19 (27.9%) |
| 6 to 18 Years | 51 (22.4%) | 187 (82.0%) |
| 19 to 25 Years | 147 (40.7%) | 60 (16.6%) |
| 25 to 34 Years | 102 (67.5%) | 38 (25.2%) |
| 35 to 44 Years | 84 (34.6%) | 188 (77.4%) |
| 45 to 54 Years | 0 (0.0%) | 126 (100.0%) |
| 55 to 64 Years | 44 (24.3%) | 137 (75.7%) |
| 65 to 74 Years | 26 (100.0%) | 9 (34.6%) |
| 75 Years and over | 89 (100.0%) | 52 (58.4%) |
| Total | 592 (40.2%) | 816 (55.4%) |
Disability Status by Sex by Age in Lockport Heights
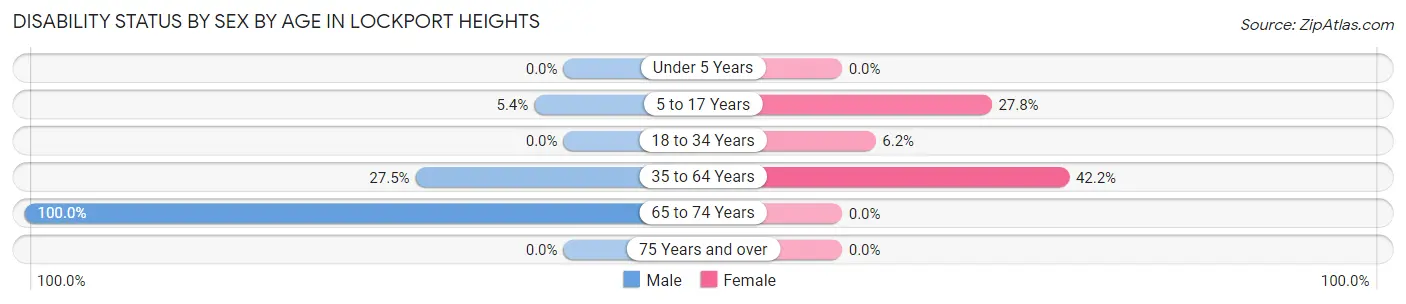
| Age Bracket | Male | Female |
| Under 5 Years | 0 (0.0%) | 0 (0.0%) |
| 5 to 17 Years | 9 (5.4%) | 20 (27.8%) |
| 18 to 34 Years | 0 (0.0%) | 18 (6.2%) |
| 35 to 64 Years | 67 (27.5%) | 129 (42.2%) |
| 65 to 74 Years | 9 (100.0%) | 0 (0.0%) |
| 75 Years and over | 0 (0.0%) | 0 (0.0%) |
Disability Class by Sex by Age in Lockport Heights
Disability Class: Hearing Difficulty
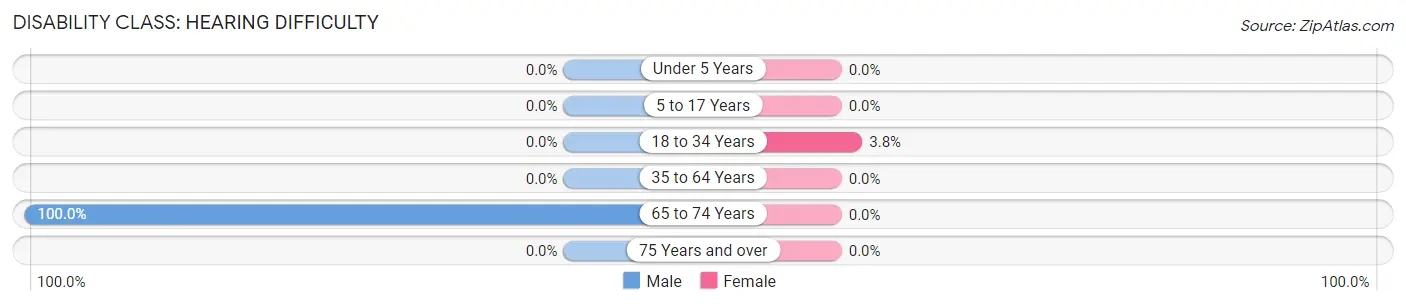
| Age Bracket | Male | Female |
| Under 5 Years | 0 (0.0%) | 0 (0.0%) |
| 5 to 17 Years | 0 (0.0%) | 0 (0.0%) |
| 18 to 34 Years | 0 (0.0%) | 11 (3.8%) |
| 35 to 64 Years | 0 (0.0%) | 0 (0.0%) |
| 65 to 74 Years | 9 (100.0%) | 0 (0.0%) |
| 75 Years and over | 0 (0.0%) | 0 (0.0%) |
Disability Class: Vision Difficulty
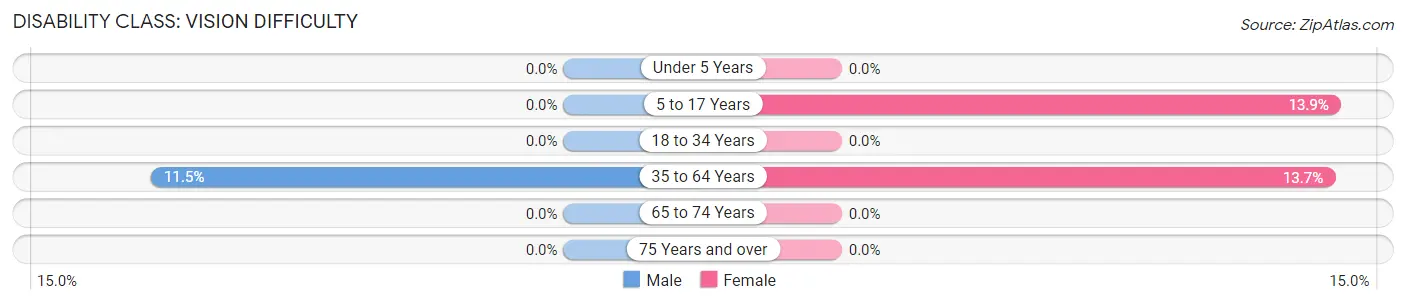
| Age Bracket | Male | Female |
| Under 5 Years | 0 (0.0%) | 0 (0.0%) |
| 5 to 17 Years | 0 (0.0%) | 10 (13.9%) |
| 18 to 34 Years | 0 (0.0%) | 0 (0.0%) |
| 35 to 64 Years | 28 (11.5%) | 42 (13.7%) |
| 65 to 74 Years | 0 (0.0%) | 0 (0.0%) |
| 75 Years and over | 0 (0.0%) | 0 (0.0%) |
Disability Class: Cognitive Difficulty
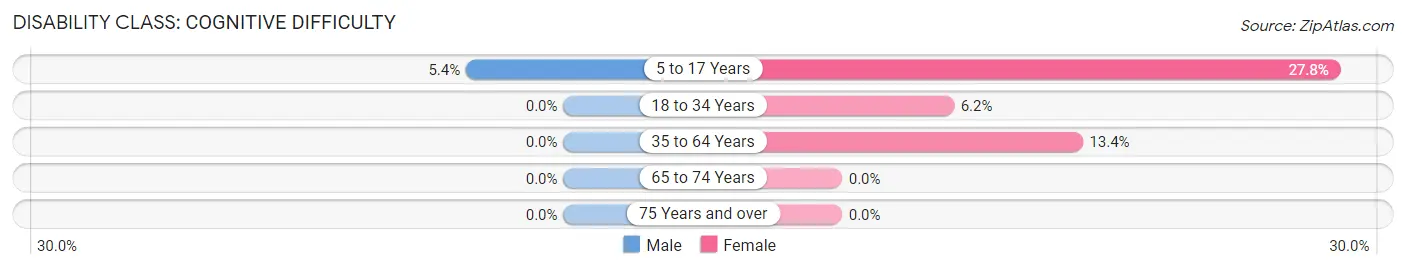
| Age Bracket | Male | Female |
| 5 to 17 Years | 9 (5.4%) | 20 (27.8%) |
| 18 to 34 Years | 0 (0.0%) | 18 (6.2%) |
| 35 to 64 Years | 0 (0.0%) | 41 (13.4%) |
| 65 to 74 Years | 0 (0.0%) | 0 (0.0%) |
| 75 Years and over | 0 (0.0%) | 0 (0.0%) |
Disability Class: Ambulatory Difficulty
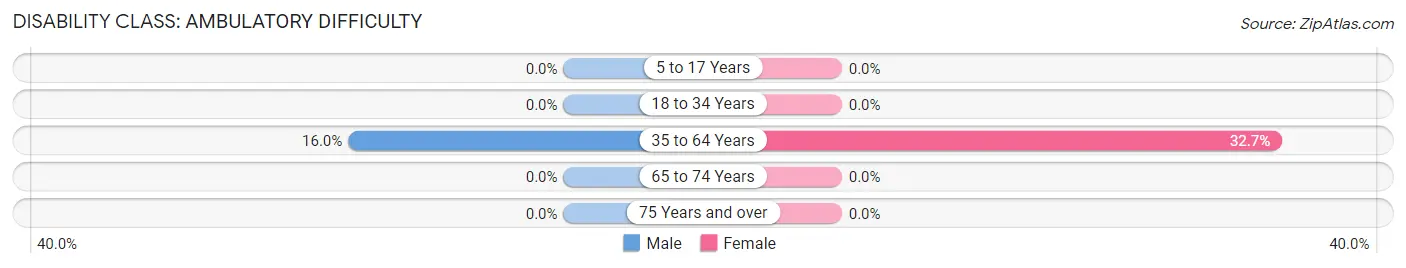
| Age Bracket | Male | Female |
| 5 to 17 Years | 0 (0.0%) | 0 (0.0%) |
| 18 to 34 Years | 0 (0.0%) | 0 (0.0%) |
| 35 to 64 Years | 39 (16.0%) | 100 (32.7%) |
| 65 to 74 Years | 0 (0.0%) | 0 (0.0%) |
| 75 Years and over | 0 (0.0%) | 0 (0.0%) |
Disability Class: Self-Care Difficulty
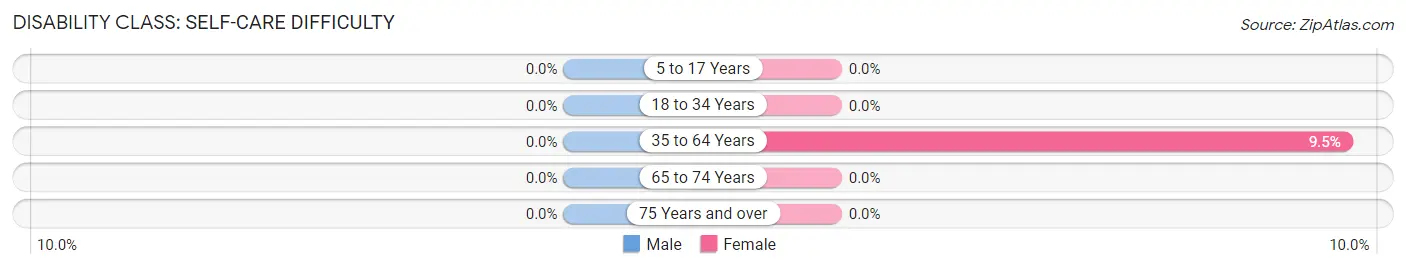
| Age Bracket | Male | Female |
| 5 to 17 Years | 0 (0.0%) | 0 (0.0%) |
| 18 to 34 Years | 0 (0.0%) | 0 (0.0%) |
| 35 to 64 Years | 0 (0.0%) | 29 (9.5%) |
| 65 to 74 Years | 0 (0.0%) | 0 (0.0%) |
| 75 Years and over | 0 (0.0%) | 0 (0.0%) |
Technology Access in Lockport Heights
Computing Device Access in Lockport Heights
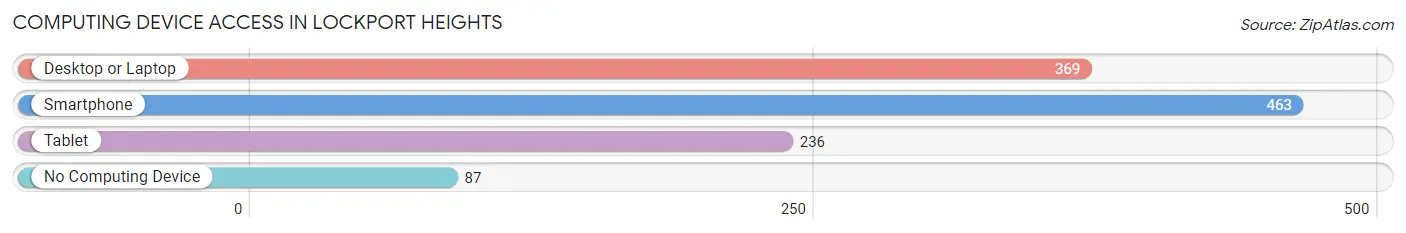
| Device Type | # Households | % Households |
| Desktop or Laptop | 369 | 67.1% |
| Smartphone | 463 | 84.2% |
| Tablet | 236 | 42.9% |
| No Computing Device | 87 | 15.8% |
| Total | 550 | 100.0% |
Internet Access in Lockport Heights
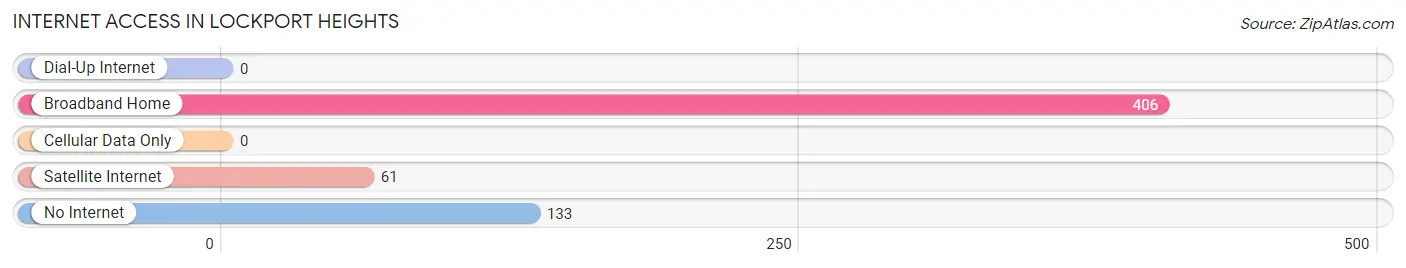
| Internet Type | # Households | % Households |
| Dial-Up Internet | 0 | 0.0% |
| Broadband Home | 406 | 73.8% |
| Cellular Data Only | 0 | 0.0% |
| Satellite Internet | 61 | 11.1% |
| No Internet | 133 | 24.2% |
| Total | 550 | 100.0% |
Lockport Heights Summary
Lockport Heights is a small unincorporated community located in Lafourche Parish, Louisiana. It is situated on the banks of Bayou Lafourche, approximately 10 miles south of Thibodaux. The community is home to a diverse population of approximately 1,000 people, with a median age of 35.
History
The area now known as Lockport Heights was originally inhabited by the Chitimacha Indians. The first European settlers arrived in the area in the late 1700s, and the community was officially established in 1820. The town was named after the nearby Lockport Lock, which was built in 1835 to control the flow of water in Bayou Lafourche.
The town grew steadily throughout the 19th century, and by the early 20th century, it had become a thriving agricultural and commercial center. The town was home to several businesses, including a sawmill, a cotton gin, and a general store.
In the 1950s, the town began to decline as the local economy shifted away from agriculture and towards oil and gas production. The town’s population decreased steadily over the next several decades, and by the 2000 census, it had fallen to just over 1,000 people.
Geography
Lockport Heights is located in southeastern Louisiana, approximately 10 miles south of Thibodaux. The town is situated on the banks of Bayou Lafourche, which flows south into the Gulf of Mexico. The town is surrounded by marshland and swampland, and is home to a variety of wildlife, including alligators, snakes, and birds.
The town is located in a humid subtropical climate zone, with hot, humid summers and mild winters. The average annual temperature is 70 degrees Fahrenheit, and the average annual precipitation is 60 inches.
Economy
The economy of Lockport Heights is largely based on agriculture and oil and gas production. The town is home to several farms, which produce a variety of crops, including corn, soybeans, and sugarcane. The town is also home to several oil and gas production companies, which employ a significant number of local residents.
In addition to agriculture and oil and gas production, the town is home to several small businesses, including restaurants, convenience stores, and auto repair shops. The town is also home to a small marina, which provides access to Bayou Lafourche.
Demographics
As of the 2000 census, the population of Lockport Heights was 1,039. The median age was 35, and the median household income was $30,000. The town is predominantly white, with a small African American population. The town is also home to a small Hispanic population, which makes up approximately 5% of the population.
The town is served by the Lafourche Parish School District, which operates several elementary, middle, and high schools in the area. The town is also home to a small library, which provides access to books, magazines, and other media.
Conclusion
Lockport Heights is a small unincorporated community located in Lafourche Parish, Louisiana. The town is situated on the banks of Bayou Lafourche, and is home to a diverse population of approximately 1,000 people. The town’s economy is largely based on agriculture and oil and gas production, and the town is served by the Lafourche Parish School District. Lockport Heights is a unique and vibrant community, and is an important part of the local culture and history.
Common Questions
What is Per Capita Income in Lockport Heights?
Per Capita income in Lockport Heights is $30,080.
What is the Median Family Income in Lockport Heights?
Median Family Income in Lockport Heights is $100,924.
What is Inequality or Gini Index in Lockport Heights?
Inequality or Gini Index in Lockport Heights is 0.46.
What is the Total Population of Lockport Heights?
Total Population of Lockport Heights is 1,473.
What is the Total Male Population of Lockport Heights?
Total Male Population of Lockport Heights is 693.
What is the Total Female Population of Lockport Heights?
Total Female Population of Lockport Heights is 780.
What is the Ratio of Males per 100 Females in Lockport Heights?
There are 88.85 Males per 100 Females in Lockport Heights.
What is the Ratio of Females per 100 Males in Lockport Heights?
There are 112.55 Females per 100 Males in Lockport Heights.
What is the Median Population Age in Lockport Heights?
Median Population Age in Lockport Heights is 32.2 Years.
What is the Average Family Size in Lockport Heights
Average Family Size in Lockport Heights is 3.2 People.
What is the Average Household Size in Lockport Heights
Average Household Size in Lockport Heights is 2.7 People.
How Large is the Labor Force in Lockport Heights?
There are 690 People in the Labor Forcein in Lockport Heights.
What is the Percentage of People in the Labor Force in Lockport Heights?
56.2% of People are in the Labor Force in Lockport Heights.