Chickasaw vs Celtic In Labor Force | Age 25-29
COMPARE
Chickasaw
Celtic
In Labor Force | Age 25-29
In Labor Force | Age 25-29 Comparison
Chickasaw
Celtics
81.9%
IN LABOR FORCE | AGE 25-29
0.0/ 100
METRIC RATING
317th/ 347
METRIC RANK
84.7%
IN LABOR FORCE | AGE 25-29
52.5/ 100
METRIC RATING
169th/ 347
METRIC RANK
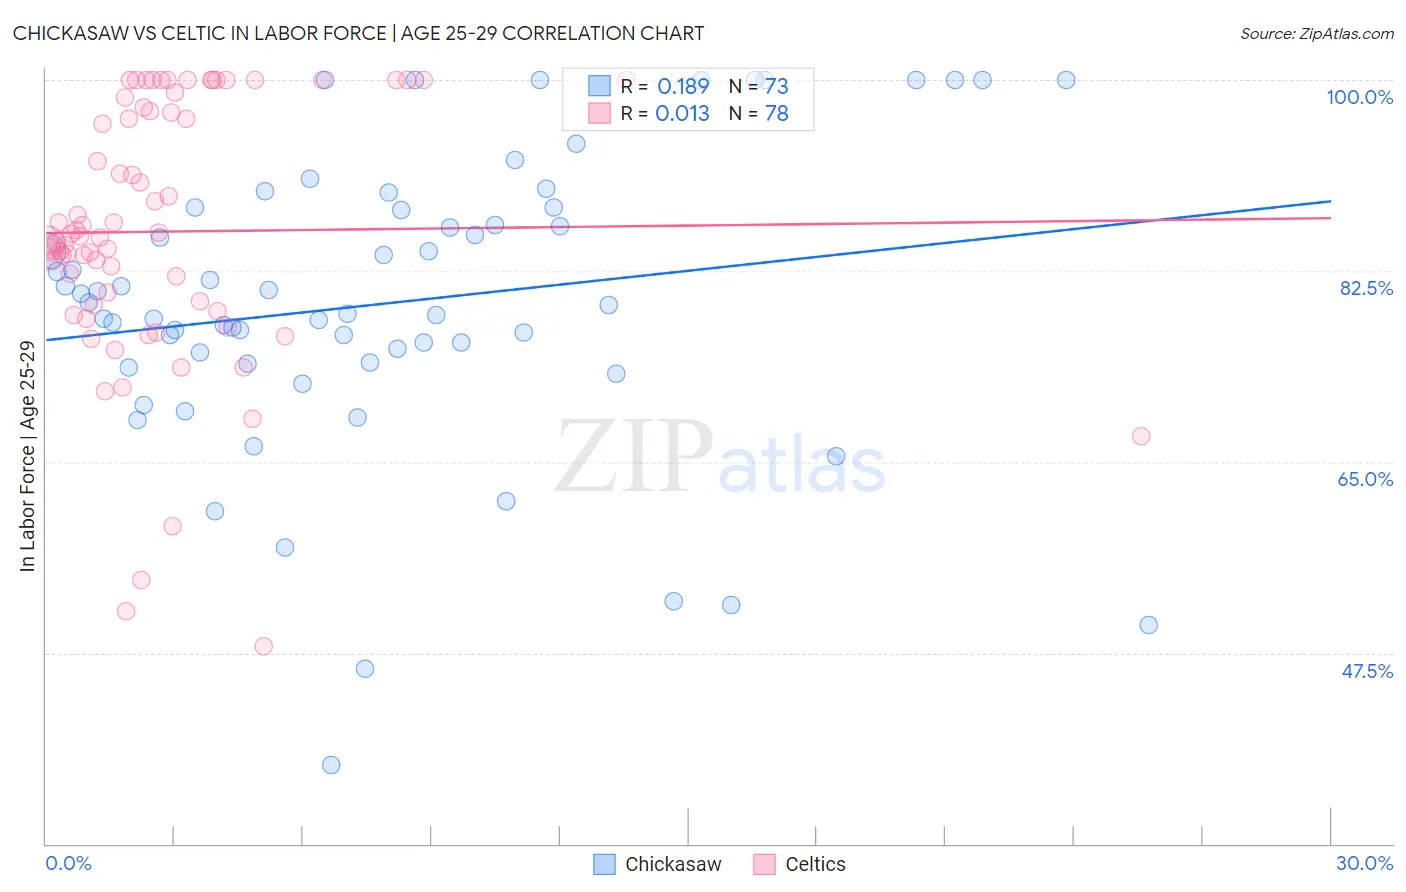
Chickasaw vs Celtic In Labor Force | Age 25-29 Correlation Chart
The statistical analysis conducted on geographies consisting of 147,700,460 people shows a poor positive correlation between the proportion of Chickasaw and labor force participation rate among population between the ages 25 and 29 in the United States with a correlation coefficient (R) of 0.189 and weighted average of 81.9%. Similarly, the statistical analysis conducted on geographies consisting of 168,838,785 people shows no correlation between the proportion of Celtics and labor force participation rate among population between the ages 25 and 29 in the United States with a correlation coefficient (R) of 0.013 and weighted average of 84.7%, a difference of 3.4%.
In Labor Force | Age 25-29 Correlation Summary
| Measurement | Chickasaw | Celtic |
| Minimum | 37.2% | 48.1% |
| Maximum | 100.0% | 100.0% |
| Range | 62.8% | 51.9% |
| Mean | 79.6% | 86.1% |
| Median | 79.3% | 85.6% |
| Interquartile 25% (IQ1) | 74.0% | 79.4% |
| Interquartile 75% (IQ3) | 88.2% | 97.5% |
| Interquartile Range (IQR) | 14.2% | 18.0% |
| Standard Deviation (Sample) | 13.5% | 12.0% |
| Standard Deviation (Population) | 13.4% | 11.9% |
Similar Demographics by In Labor Force | Age 25-29
Demographics Similar to Chickasaw by In Labor Force | Age 25-29
In terms of in labor force | age 25-29, the demographic groups most similar to Chickasaw are Comanche (81.9%, a difference of 0.010%), Mexican (81.9%, a difference of 0.070%), Immigrants from Mexico (82.0%, a difference of 0.16%), Seminole (81.7%, a difference of 0.23%), and Colville (81.6%, a difference of 0.28%).
| Demographics | Rating | Rank | In Labor Force | Age 25-29 |
| Osage | 0.0 /100 | #310 | Tragic 82.3% |
| Alaskan Athabascans | 0.0 /100 | #311 | Tragic 82.3% |
| Hispanics or Latinos | 0.0 /100 | #312 | Tragic 82.2% |
| Yaqui | 0.0 /100 | #313 | Tragic 82.2% |
| Cherokee | 0.0 /100 | #314 | Tragic 82.1% |
| Immigrants | Mexico | 0.0 /100 | #315 | Tragic 82.0% |
| Mexicans | 0.0 /100 | #316 | Tragic 81.9% |
| Chickasaw | 0.0 /100 | #317 | Tragic 81.9% |
| Comanche | 0.0 /100 | #318 | Tragic 81.9% |
| Seminole | 0.0 /100 | #319 | Tragic 81.7% |
| Colville | 0.0 /100 | #320 | Tragic 81.6% |
| Shoshone | 0.0 /100 | #321 | Tragic 81.6% |
| Kiowa | 0.0 /100 | #322 | Tragic 81.6% |
| Alaska Natives | 0.0 /100 | #323 | Tragic 81.6% |
| Houma | 0.0 /100 | #324 | Tragic 81.2% |
Demographics Similar to Celtics by In Labor Force | Age 25-29
In terms of in labor force | age 25-29, the demographic groups most similar to Celtics are Tongan (84.7%, a difference of 0.0%), Immigrants from Vietnam (84.7%, a difference of 0.010%), Immigrants from Western Europe (84.7%, a difference of 0.010%), South American (84.7%, a difference of 0.020%), and Assyrian/Chaldean/Syriac (84.7%, a difference of 0.020%).
| Demographics | Rating | Rank | In Labor Force | Age 25-29 |
| Immigrants | Colombia | 58.3 /100 | #162 | Average 84.7% |
| Argentineans | 57.9 /100 | #163 | Average 84.7% |
| Ghanaians | 57.6 /100 | #164 | Average 84.7% |
| Immigrants | Burma/Myanmar | 57.4 /100 | #165 | Average 84.7% |
| Immigrants | Spain | 56.9 /100 | #166 | Average 84.7% |
| Indonesians | 56.5 /100 | #167 | Average 84.7% |
| South Americans | 54.9 /100 | #168 | Average 84.7% |
| Celtics | 52.5 /100 | #169 | Average 84.7% |
| Tongans | 52.4 /100 | #170 | Average 84.7% |
| Immigrants | Vietnam | 50.5 /100 | #171 | Average 84.7% |
| Immigrants | Western Europe | 50.4 /100 | #172 | Average 84.7% |
| Assyrians/Chaldeans/Syriacs | 50.2 /100 | #173 | Average 84.7% |
| Palestinians | 50.0 /100 | #174 | Average 84.7% |
| Hungarians | 47.8 /100 | #175 | Average 84.6% |
| Malaysians | 46.8 /100 | #176 | Average 84.6% |