Cuban vs Spanish American Indian In Labor Force | Age 20-24
COMPARE
Cuban
Spanish American Indian
In Labor Force | Age 20-24
In Labor Force | Age 20-24 Comparison
Cubans
Spanish American Indians
72.5%
IN LABOR FORCE | AGE 20-24
0.0/ 100
METRIC RATING
301st/ 347
METRIC RANK
73.7%
IN LABOR FORCE | AGE 20-24
0.8/ 100
METRIC RATING
256th/ 347
METRIC RANK
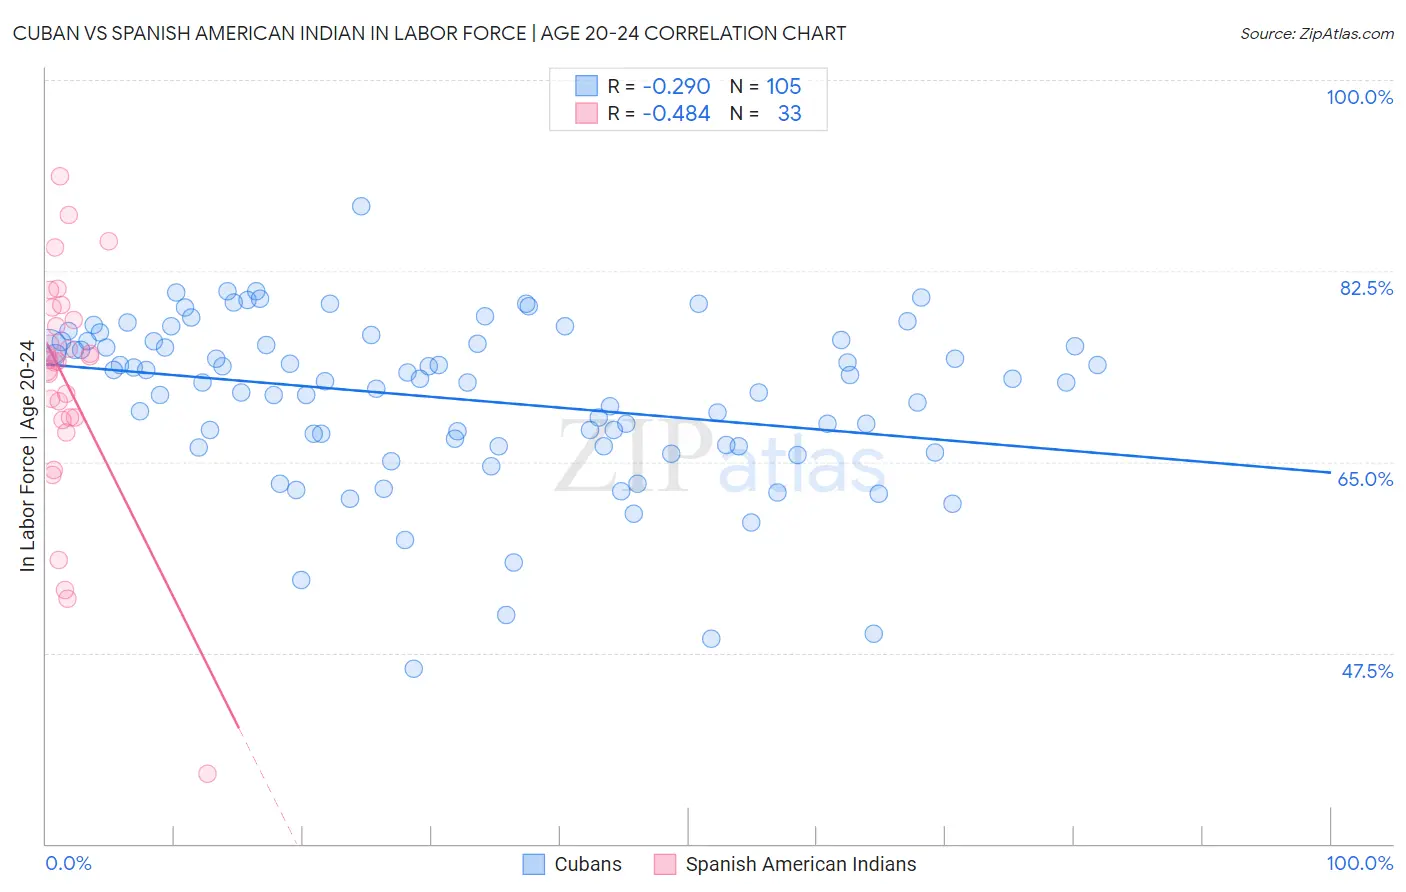
Cuban vs Spanish American Indian In Labor Force | Age 20-24 Correlation Chart
The statistical analysis conducted on geographies consisting of 449,113,848 people shows a weak negative correlation between the proportion of Cubans and labor force participation rate among population between the ages 20 and 24 in the United States with a correlation coefficient (R) of -0.290 and weighted average of 72.5%. Similarly, the statistical analysis conducted on geographies consisting of 73,146,145 people shows a moderate negative correlation between the proportion of Spanish American Indians and labor force participation rate among population between the ages 20 and 24 in the United States with a correlation coefficient (R) of -0.484 and weighted average of 73.7%, a difference of 1.7%.
In Labor Force | Age 20-24 Correlation Summary
| Measurement | Cuban | Spanish American Indian |
| Minimum | 46.0% | 36.4% |
| Maximum | 88.4% | 91.1% |
| Range | 42.4% | 54.7% |
| Mean | 70.8% | 72.2% |
| Median | 72.4% | 74.2% |
| Interquartile 25% (IQ1) | 66.4% | 68.9% |
| Interquartile 75% (IQ3) | 76.0% | 78.6% |
| Interquartile Range (IQR) | 9.6% | 9.7% |
| Standard Deviation (Sample) | 7.6% | 10.8% |
| Standard Deviation (Population) | 7.6% | 10.7% |
Similar Demographics by In Labor Force | Age 20-24
Demographics Similar to Cubans by In Labor Force | Age 20-24
In terms of in labor force | age 20-24, the demographic groups most similar to Cubans are Armenian (72.5%, a difference of 0.070%), Iranian (72.6%, a difference of 0.090%), Native/Alaskan (72.4%, a difference of 0.090%), Ecuadorian (72.4%, a difference of 0.10%), and Immigrants from West Indies (72.4%, a difference of 0.11%).
| Demographics | Rating | Rank | In Labor Force | Age 20-24 |
| Immigrants | Argentina | 0.0 /100 | #294 | Tragic 72.8% |
| Okinawans | 0.0 /100 | #295 | Tragic 72.7% |
| Jamaicans | 0.0 /100 | #296 | Tragic 72.7% |
| Central American Indians | 0.0 /100 | #297 | Tragic 72.7% |
| Israelis | 0.0 /100 | #298 | Tragic 72.6% |
| Iranians | 0.0 /100 | #299 | Tragic 72.6% |
| Armenians | 0.0 /100 | #300 | Tragic 72.5% |
| Cubans | 0.0 /100 | #301 | Tragic 72.5% |
| Natives/Alaskans | 0.0 /100 | #302 | Tragic 72.4% |
| Ecuadorians | 0.0 /100 | #303 | Tragic 72.4% |
| Immigrants | West Indies | 0.0 /100 | #304 | Tragic 72.4% |
| Immigrants | Singapore | 0.0 /100 | #305 | Tragic 72.4% |
| Immigrants | Jamaica | 0.0 /100 | #306 | Tragic 72.4% |
| Immigrants | Ecuador | 0.0 /100 | #307 | Tragic 72.3% |
| Soviet Union | 0.0 /100 | #308 | Tragic 72.3% |
Demographics Similar to Spanish American Indians by In Labor Force | Age 20-24
In terms of in labor force | age 20-24, the demographic groups most similar to Spanish American Indians are Paraguayan (73.7%, a difference of 0.020%), Immigrants from Pakistan (73.8%, a difference of 0.040%), Egyptian (73.7%, a difference of 0.060%), Arapaho (73.8%, a difference of 0.070%), and Ute (73.8%, a difference of 0.070%).
| Demographics | Rating | Rank | In Labor Force | Age 20-24 |
| Blacks/African Americans | 1.3 /100 | #249 | Tragic 73.9% |
| Immigrants | Belgium | 1.3 /100 | #250 | Tragic 73.9% |
| Immigrants | Egypt | 1.2 /100 | #251 | Tragic 73.8% |
| Immigrants | Kazakhstan | 1.1 /100 | #252 | Tragic 73.8% |
| Arapaho | 1.0 /100 | #253 | Tragic 73.8% |
| Ute | 1.0 /100 | #254 | Tragic 73.8% |
| Immigrants | Pakistan | 0.9 /100 | #255 | Tragic 73.8% |
| Spanish American Indians | 0.8 /100 | #256 | Tragic 73.7% |
| Paraguayans | 0.8 /100 | #257 | Tragic 73.7% |
| Egyptians | 0.7 /100 | #258 | Tragic 73.7% |
| Dutch West Indians | 0.7 /100 | #259 | Tragic 73.7% |
| Immigrants | Turkey | 0.7 /100 | #260 | Tragic 73.7% |
| Houma | 0.6 /100 | #261 | Tragic 73.7% |
| Asians | 0.6 /100 | #262 | Tragic 73.7% |
| Immigrants | Asia | 0.5 /100 | #263 | Tragic 73.6% |