European vs Immigrants from Australia In Labor Force | Age 16-19
COMPARE
European
Immigrants from Australia
In Labor Force | Age 16-19
In Labor Force | Age 16-19 Comparison
Europeans
Immigrants from Australia
41.1%
IN LABOR FORCE | AGE 16-19
100.0/ 100
METRIC RATING
44th/ 347
METRIC RANK
35.1%
IN LABOR FORCE | AGE 16-19
3.6/ 100
METRIC RATING
236th/ 347
METRIC RANK
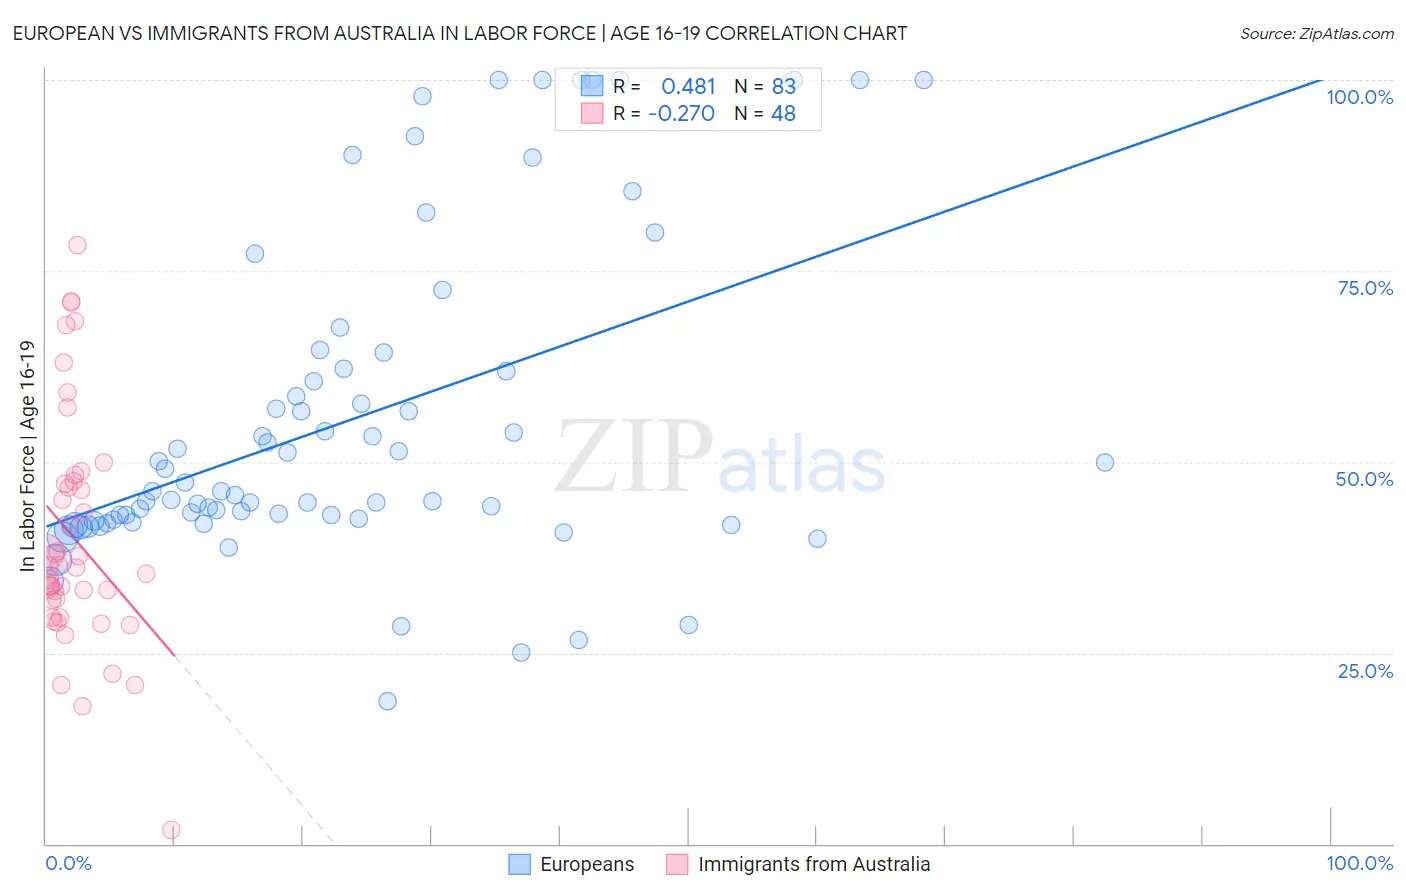
European vs Immigrants from Australia In Labor Force | Age 16-19 Correlation Chart
The statistical analysis conducted on geographies consisting of 558,493,487 people shows a moderate positive correlation between the proportion of Europeans and labor force participation rate among population between the ages 16 and 19 in the United States with a correlation coefficient (R) of 0.481 and weighted average of 41.1%. Similarly, the statistical analysis conducted on geographies consisting of 226,866,182 people shows a weak negative correlation between the proportion of Immigrants from Australia and labor force participation rate among population between the ages 16 and 19 in the United States with a correlation coefficient (R) of -0.270 and weighted average of 35.1%, a difference of 17.3%.
In Labor Force | Age 16-19 Correlation Summary
| Measurement | European | Immigrants from Australia |
| Minimum | 18.6% | 1.8% |
| Maximum | 100.0% | 78.4% |
| Range | 81.4% | 76.6% |
| Mean | 55.4% | 39.9% |
| Median | 46.1% | 36.2% |
| Interquartile 25% (IQ1) | 42.3% | 30.8% |
| Interquartile 75% (IQ3) | 62.2% | 47.3% |
| Interquartile Range (IQR) | 20.0% | 16.5% |
| Standard Deviation (Sample) | 21.0% | 15.3% |
| Standard Deviation (Population) | 20.9% | 15.2% |
Similar Demographics by In Labor Force | Age 16-19
Demographics Similar to Europeans by In Labor Force | Age 16-19
In terms of in labor force | age 16-19, the demographic groups most similar to Europeans are Croatian (41.1%, a difference of 0.040%), Tongan (41.2%, a difference of 0.10%), Immigrants from Sudan (41.0%, a difference of 0.36%), White/Caucasian (41.3%, a difference of 0.41%), and Celtic (41.3%, a difference of 0.42%).
| Demographics | Rating | Rank | In Labor Force | Age 16-19 |
| Immigrants | Congo | 100.0 /100 | #37 | Exceptional 41.7% |
| Sioux | 100.0 /100 | #38 | Exceptional 41.5% |
| Scotch-Irish | 100.0 /100 | #39 | Exceptional 41.5% |
| Immigrants | Liberia | 100.0 /100 | #40 | Exceptional 41.5% |
| Celtics | 100.0 /100 | #41 | Exceptional 41.3% |
| Whites/Caucasians | 100.0 /100 | #42 | Exceptional 41.3% |
| Tongans | 100.0 /100 | #43 | Exceptional 41.2% |
| Europeans | 100.0 /100 | #44 | Exceptional 41.1% |
| Croatians | 100.0 /100 | #45 | Exceptional 41.1% |
| Immigrants | Sudan | 100.0 /100 | #46 | Exceptional 41.0% |
| Carpatho Rusyns | 100.0 /100 | #47 | Exceptional 40.8% |
| Icelanders | 100.0 /100 | #48 | Exceptional 40.8% |
| Cree | 100.0 /100 | #49 | Exceptional 40.8% |
| Indonesians | 100.0 /100 | #50 | Exceptional 40.7% |
| Immigrants | Zaire | 100.0 /100 | #51 | Exceptional 40.7% |
Demographics Similar to Immigrants from Australia by In Labor Force | Age 16-19
In terms of in labor force | age 16-19, the demographic groups most similar to Immigrants from Australia are Immigrants from India (35.0%, a difference of 0.030%), Immigrants from Vietnam (35.0%, a difference of 0.070%), Immigrants from Philippines (35.1%, a difference of 0.14%), Inupiat (35.0%, a difference of 0.16%), and Immigrants from Mexico (35.1%, a difference of 0.22%).
| Demographics | Rating | Rank | In Labor Force | Age 16-19 |
| Immigrants | Lebanon | 5.0 /100 | #229 | Tragic 35.2% |
| Immigrants | Honduras | 4.9 /100 | #230 | Tragic 35.2% |
| Immigrants | Syria | 4.5 /100 | #231 | Tragic 35.2% |
| Immigrants | Kazakhstan | 4.5 /100 | #232 | Tragic 35.2% |
| Immigrants | France | 4.3 /100 | #233 | Tragic 35.1% |
| Immigrants | Mexico | 4.2 /100 | #234 | Tragic 35.1% |
| Immigrants | Philippines | 4.0 /100 | #235 | Tragic 35.1% |
| Immigrants | Australia | 3.6 /100 | #236 | Tragic 35.1% |
| Immigrants | India | 3.5 /100 | #237 | Tragic 35.0% |
| Immigrants | Vietnam | 3.4 /100 | #238 | Tragic 35.0% |
| Inupiat | 3.2 /100 | #239 | Tragic 35.0% |
| Immigrants | Central America | 3.0 /100 | #240 | Tragic 35.0% |
| Immigrants | Ireland | 2.9 /100 | #241 | Tragic 35.0% |
| Uruguayans | 2.6 /100 | #242 | Tragic 34.9% |
| Pueblo | 2.6 /100 | #243 | Tragic 34.9% |