Greek vs Costa Rican In Labor Force | Age 45-54
COMPARE
Greek
Costa Rican
In Labor Force | Age 45-54
In Labor Force | Age 45-54 Comparison
Greeks
Costa Ricans
83.3%
IN LABOR FORCE | AGE 45-54
95.9/ 100
METRIC RATING
85th/ 347
METRIC RANK
82.8%
IN LABOR FORCE | AGE 45-54
50.0/ 100
METRIC RATING
174th/ 347
METRIC RANK
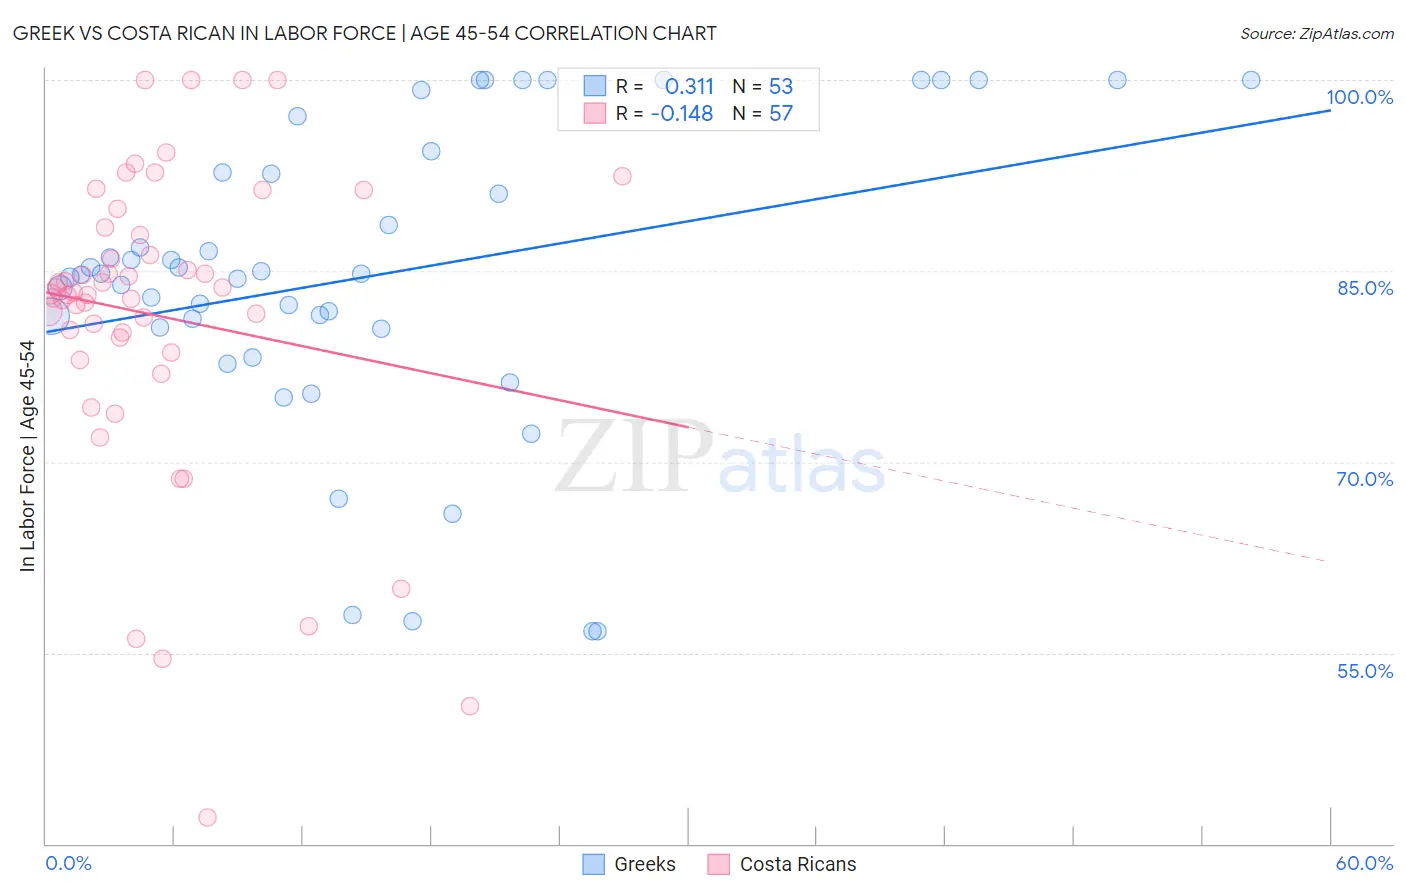
Greek vs Costa Rican In Labor Force | Age 45-54 Correlation Chart
The statistical analysis conducted on geographies consisting of 482,326,237 people shows a mild positive correlation between the proportion of Greeks and labor force participation rate among population between the ages 45 and 54 in the United States with a correlation coefficient (R) of 0.311 and weighted average of 83.3%. Similarly, the statistical analysis conducted on geographies consisting of 253,468,855 people shows a poor negative correlation between the proportion of Costa Ricans and labor force participation rate among population between the ages 45 and 54 in the United States with a correlation coefficient (R) of -0.148 and weighted average of 82.8%, a difference of 0.69%.
In Labor Force | Age 45-54 Correlation Summary
| Measurement | Greek | Costa Rican |
| Minimum | 56.7% | 42.1% |
| Maximum | 100.0% | 100.0% |
| Range | 43.3% | 57.9% |
| Mean | 84.6% | 81.5% |
| Median | 84.8% | 83.2% |
| Interquartile 25% (IQ1) | 80.5% | 79.2% |
| Interquartile 75% (IQ3) | 93.6% | 88.1% |
| Interquartile Range (IQR) | 13.1% | 8.9% |
| Standard Deviation (Sample) | 11.8% | 12.1% |
| Standard Deviation (Population) | 11.7% | 12.0% |
Similar Demographics by In Labor Force | Age 45-54
Demographics Similar to Greeks by In Labor Force | Age 45-54
In terms of in labor force | age 45-54, the demographic groups most similar to Greeks are Immigrants from Bosnia and Herzegovina (83.3%, a difference of 0.010%), Immigrants from Northern Africa (83.3%, a difference of 0.010%), Immigrants from Eastern Asia (83.4%, a difference of 0.020%), Immigrants from Zimbabwe (83.4%, a difference of 0.020%), and Immigrants from Eastern Europe (83.3%, a difference of 0.020%).
| Demographics | Rating | Rank | In Labor Force | Age 45-54 |
| Immigrants | Egypt | 96.6 /100 | #78 | Exceptional 83.4% |
| Belgians | 96.5 /100 | #79 | Exceptional 83.4% |
| Immigrants | Croatia | 96.5 /100 | #80 | Exceptional 83.4% |
| Jordanians | 96.4 /100 | #81 | Exceptional 83.4% |
| Immigrants | Eastern Asia | 96.3 /100 | #82 | Exceptional 83.4% |
| Immigrants | Zimbabwe | 96.3 /100 | #83 | Exceptional 83.4% |
| Immigrants | Bosnia and Herzegovina | 96.0 /100 | #84 | Exceptional 83.3% |
| Greeks | 95.9 /100 | #85 | Exceptional 83.3% |
| Immigrants | Northern Africa | 95.7 /100 | #86 | Exceptional 83.3% |
| Immigrants | Eastern Europe | 95.6 /100 | #87 | Exceptional 83.3% |
| Immigrants | Asia | 95.6 /100 | #88 | Exceptional 83.3% |
| Indians (Asian) | 95.5 /100 | #89 | Exceptional 83.3% |
| Immigrants | Japan | 95.5 /100 | #90 | Exceptional 83.3% |
| South Americans | 95.5 /100 | #91 | Exceptional 83.3% |
| Danes | 95.3 /100 | #92 | Exceptional 83.3% |
Demographics Similar to Costa Ricans by In Labor Force | Age 45-54
In terms of in labor force | age 45-54, the demographic groups most similar to Costa Ricans are Nicaraguan (82.8%, a difference of 0.0%), Icelander (82.8%, a difference of 0.020%), Immigrants from Liberia (82.7%, a difference of 0.020%), Pakistani (82.8%, a difference of 0.030%), and Immigrants from Zaire (82.8%, a difference of 0.030%).
| Demographics | Rating | Rank | In Labor Force | Age 45-54 |
| Swiss | 56.5 /100 | #167 | Average 82.8% |
| Immigrants | South Africa | 55.8 /100 | #168 | Average 82.8% |
| Immigrants | Western Africa | 54.1 /100 | #169 | Average 82.8% |
| Pakistanis | 53.2 /100 | #170 | Average 82.8% |
| Immigrants | Zaire | 52.9 /100 | #171 | Average 82.8% |
| Icelanders | 51.8 /100 | #172 | Average 82.8% |
| Nicaraguans | 50.3 /100 | #173 | Average 82.8% |
| Costa Ricans | 50.0 /100 | #174 | Average 82.8% |
| Immigrants | Liberia | 47.9 /100 | #175 | Average 82.7% |
| Northern Europeans | 46.9 /100 | #176 | Average 82.7% |
| Immigrants | Nicaragua | 44.6 /100 | #177 | Average 82.7% |
| Nigerians | 40.5 /100 | #178 | Average 82.7% |
| Immigrants | Switzerland | 39.4 /100 | #179 | Fair 82.7% |
| Hungarians | 38.0 /100 | #180 | Fair 82.7% |
| Israelis | 37.7 /100 | #181 | Fair 82.7% |