Immigrants from Cambodia vs Kenyan In Labor Force | Age 20-64
COMPARE
Immigrants from Cambodia
Kenyan
In Labor Force | Age 20-64
In Labor Force | Age 20-64 Comparison
Immigrants from Cambodia
Kenyans
79.3%
IN LABOR FORCE | AGE 20-64
17.6/ 100
METRIC RATING
204th/ 347
METRIC RANK
80.8%
IN LABOR FORCE | AGE 20-64
100.0/ 100
METRIC RATING
25th/ 347
METRIC RANK
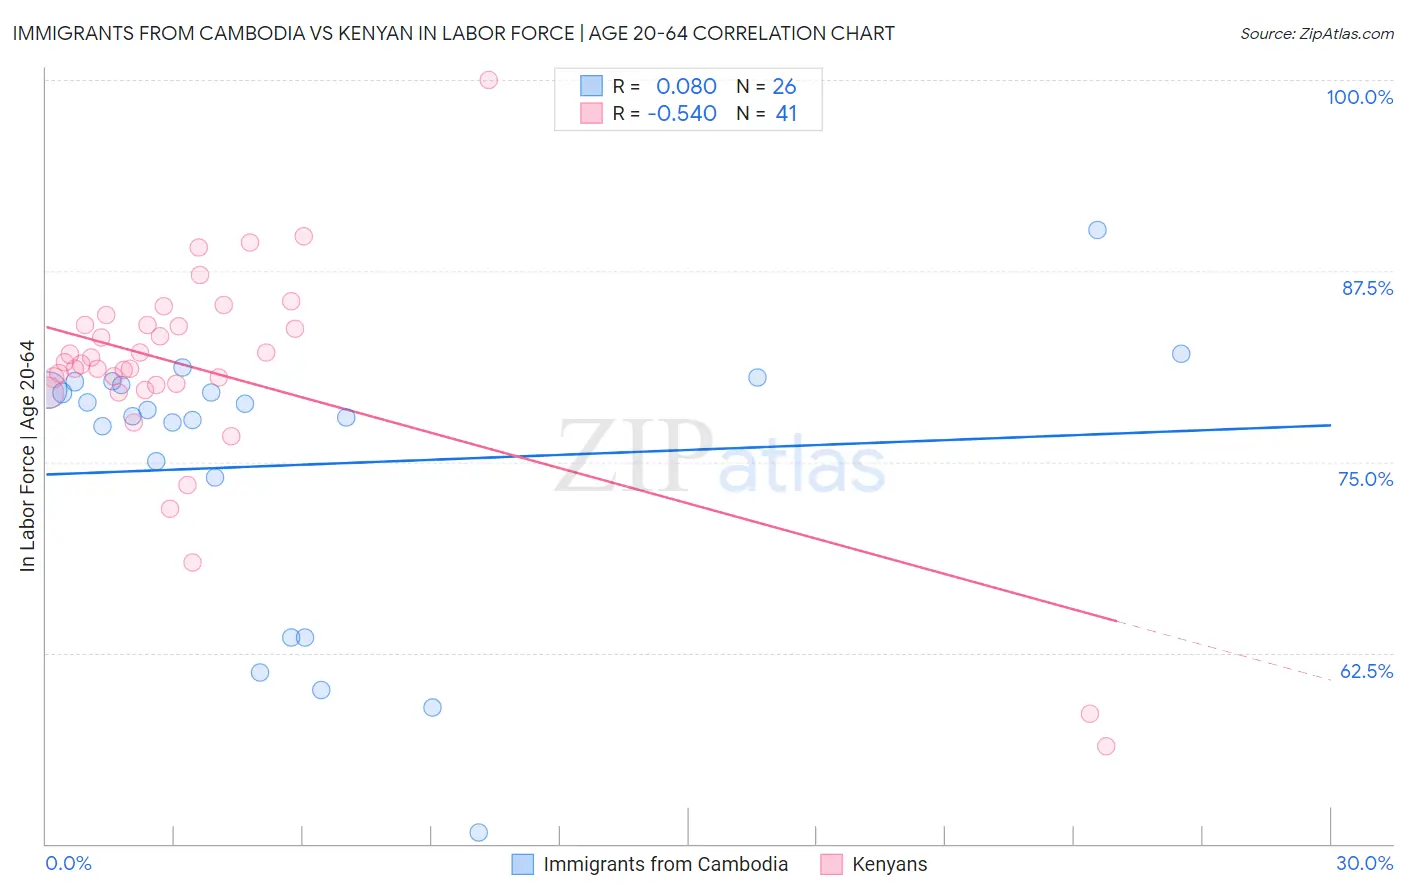
Immigrants from Cambodia vs Kenyan In Labor Force | Age 20-64 Correlation Chart
The statistical analysis conducted on geographies consisting of 205,155,425 people shows a slight positive correlation between the proportion of Immigrants from Cambodia and labor force participation rate among population between the ages 20 and 64 in the United States with a correlation coefficient (R) of 0.080 and weighted average of 79.3%. Similarly, the statistical analysis conducted on geographies consisting of 168,242,880 people shows a substantial negative correlation between the proportion of Kenyans and labor force participation rate among population between the ages 20 and 64 in the United States with a correlation coefficient (R) of -0.540 and weighted average of 80.8%, a difference of 1.9%.
In Labor Force | Age 20-64 Correlation Summary
| Measurement | Immigrants from Cambodia | Kenyan |
| Minimum | 50.7% | 56.4% |
| Maximum | 90.2% | 100.0% |
| Range | 39.5% | 43.6% |
| Mean | 74.8% | 80.9% |
| Median | 78.2% | 81.4% |
| Interquartile 25% (IQ1) | 74.0% | 79.8% |
| Interquartile 75% (IQ3) | 80.1% | 84.0% |
| Interquartile Range (IQR) | 6.1% | 4.1% |
| Standard Deviation (Sample) | 9.2% | 7.4% |
| Standard Deviation (Population) | 9.0% | 7.3% |
Similar Demographics by In Labor Force | Age 20-64
Demographics Similar to Immigrants from Cambodia by In Labor Force | Age 20-64
In terms of in labor force | age 20-64, the demographic groups most similar to Immigrants from Cambodia are Iraqi (79.3%, a difference of 0.0%), Immigrants from Congo (79.3%, a difference of 0.0%), Nicaraguan (79.3%, a difference of 0.010%), Immigrants from Ecuador (79.3%, a difference of 0.010%), and Immigrants from Oceania (79.3%, a difference of 0.020%).
| Demographics | Rating | Rank | In Labor Force | Age 20-64 |
| Immigrants | Senegal | 22.5 /100 | #197 | Fair 79.4% |
| Immigrants | Laos | 21.5 /100 | #198 | Fair 79.4% |
| Dutch | 20.2 /100 | #199 | Fair 79.3% |
| Immigrants | Oceania | 19.1 /100 | #200 | Poor 79.3% |
| Immigrants | Nicaragua | 19.0 /100 | #201 | Poor 79.3% |
| Nicaraguans | 18.3 /100 | #202 | Poor 79.3% |
| Iraqis | 17.7 /100 | #203 | Poor 79.3% |
| Immigrants | Cambodia | 17.6 /100 | #204 | Poor 79.3% |
| Immigrants | Congo | 17.5 /100 | #205 | Poor 79.3% |
| Immigrants | Ecuador | 16.9 /100 | #206 | Poor 79.3% |
| Sub-Saharan Africans | 16.5 /100 | #207 | Poor 79.3% |
| British | 16.5 /100 | #208 | Poor 79.3% |
| Bangladeshis | 16.4 /100 | #209 | Poor 79.3% |
| Haitians | 16.1 /100 | #210 | Poor 79.3% |
| Europeans | 15.3 /100 | #211 | Poor 79.3% |
Demographics Similar to Kenyans by In Labor Force | Age 20-64
In terms of in labor force | age 20-64, the demographic groups most similar to Kenyans are Immigrants from Morocco (80.8%, a difference of 0.010%), Immigrants from Bosnia and Herzegovina (80.8%, a difference of 0.020%), Immigrants from Serbia (80.8%, a difference of 0.020%), Sudanese (80.8%, a difference of 0.030%), and Immigrants from Kenya (80.7%, a difference of 0.090%).
| Demographics | Rating | Rank | In Labor Force | Age 20-64 |
| Immigrants | Bulgaria | 100.0 /100 | #18 | Exceptional 81.0% |
| Zimbabweans | 100.0 /100 | #19 | Exceptional 81.0% |
| Thais | 100.0 /100 | #20 | Exceptional 80.9% |
| Liberians | 100.0 /100 | #21 | Exceptional 80.9% |
| Sudanese | 100.0 /100 | #22 | Exceptional 80.8% |
| Immigrants | Bosnia and Herzegovina | 100.0 /100 | #23 | Exceptional 80.8% |
| Immigrants | Morocco | 100.0 /100 | #24 | Exceptional 80.8% |
| Kenyans | 100.0 /100 | #25 | Exceptional 80.8% |
| Immigrants | Serbia | 100.0 /100 | #26 | Exceptional 80.8% |
| Immigrants | Kenya | 99.9 /100 | #27 | Exceptional 80.7% |
| Immigrants | Uganda | 99.9 /100 | #28 | Exceptional 80.7% |
| Immigrants | South Central Asia | 99.9 /100 | #29 | Exceptional 80.7% |
| Immigrants | North Macedonia | 99.9 /100 | #30 | Exceptional 80.7% |
| Immigrants | Lithuania | 99.9 /100 | #31 | Exceptional 80.7% |
| Immigrants | Ireland | 99.9 /100 | #32 | Exceptional 80.7% |