Immigrants from Scotland vs Immigrants from Indonesia In Labor Force | Age 20-24
COMPARE
Immigrants from Scotland
Immigrants from Indonesia
In Labor Force | Age 20-24
In Labor Force | Age 20-24 Comparison
Immigrants from Scotland
Immigrants from Indonesia
75.8%
IN LABOR FORCE | AGE 20-24
93.7/ 100
METRIC RATING
125th/ 347
METRIC RANK
73.4%
IN LABOR FORCE | AGE 20-24
0.3/ 100
METRIC RATING
271st/ 347
METRIC RANK
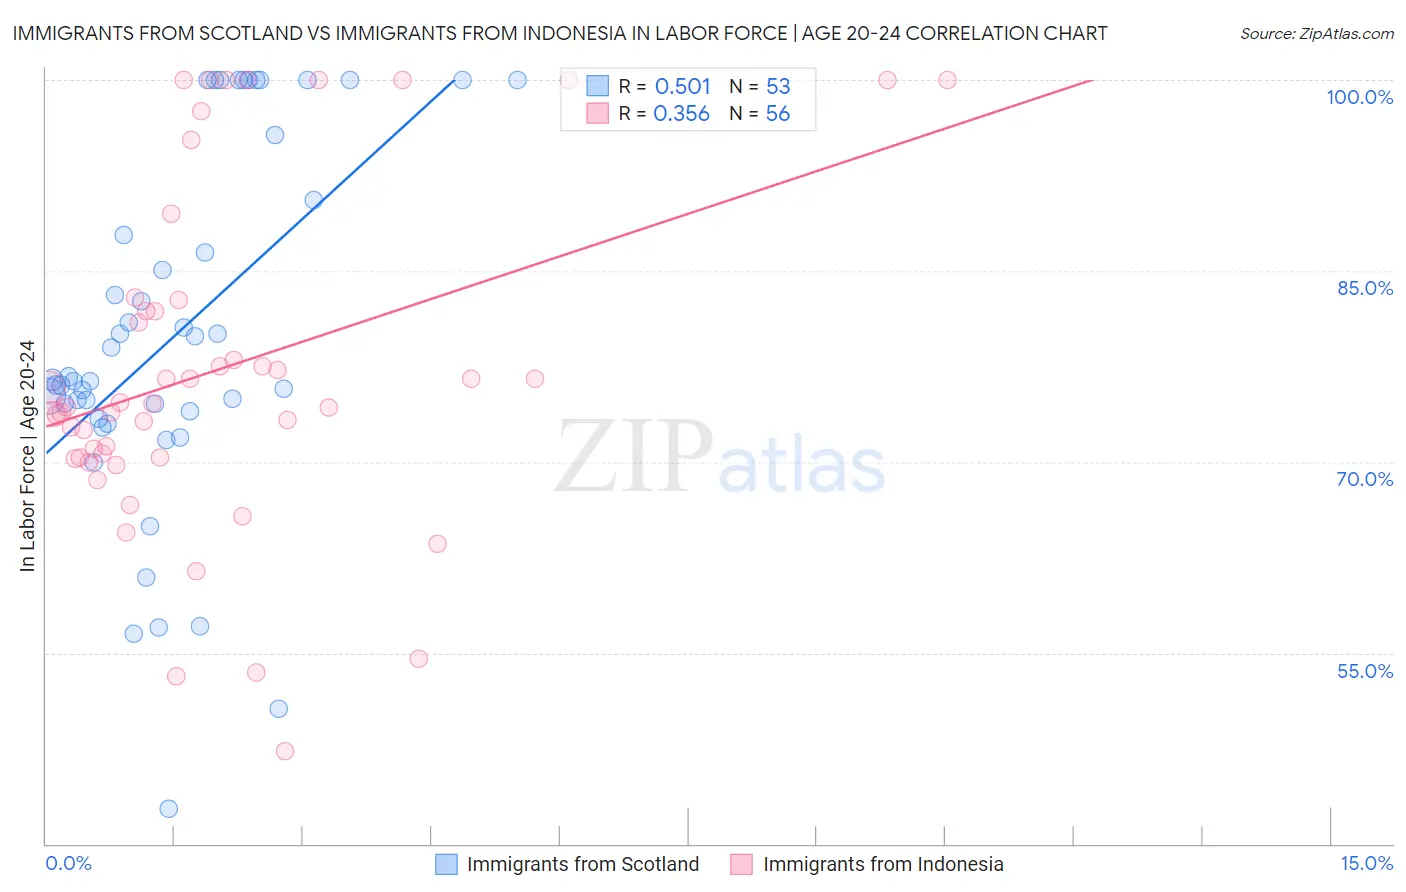
Immigrants from Scotland vs Immigrants from Indonesia In Labor Force | Age 20-24 Correlation Chart
The statistical analysis conducted on geographies consisting of 196,345,554 people shows a substantial positive correlation between the proportion of Immigrants from Scotland and labor force participation rate among population between the ages 20 and 24 in the United States with a correlation coefficient (R) of 0.501 and weighted average of 75.8%. Similarly, the statistical analysis conducted on geographies consisting of 215,731,978 people shows a mild positive correlation between the proportion of Immigrants from Indonesia and labor force participation rate among population between the ages 20 and 24 in the United States with a correlation coefficient (R) of 0.356 and weighted average of 73.4%, a difference of 3.2%.
In Labor Force | Age 20-24 Correlation Summary
| Measurement | Immigrants from Scotland | Immigrants from Indonesia |
| Minimum | 42.7% | 47.3% |
| Maximum | 100.0% | 100.0% |
| Range | 57.3% | 52.7% |
| Mean | 80.1% | 77.4% |
| Median | 76.4% | 74.4% |
| Interquartile 25% (IQ1) | 73.7% | 70.4% |
| Interquartile 75% (IQ3) | 93.2% | 82.3% |
| Interquartile Range (IQR) | 19.5% | 11.9% |
| Standard Deviation (Sample) | 14.2% | 13.3% |
| Standard Deviation (Population) | 14.0% | 13.1% |
Similar Demographics by In Labor Force | Age 20-24
Demographics Similar to Immigrants from Scotland by In Labor Force | Age 20-24
In terms of in labor force | age 20-24, the demographic groups most similar to Immigrants from Scotland are Immigrants from Sierra Leone (75.8%, a difference of 0.010%), Pakistani (75.8%, a difference of 0.030%), Immigrants from Bulgaria (75.8%, a difference of 0.030%), Immigrants from Serbia (75.8%, a difference of 0.040%), and Brazilian (75.8%, a difference of 0.040%).
| Demographics | Rating | Rank | In Labor Force | Age 20-24 |
| Spanish Americans | 94.8 /100 | #118 | Exceptional 75.8% |
| Immigrants | Portugal | 94.8 /100 | #119 | Exceptional 75.8% |
| Immigrants | Africa | 94.6 /100 | #120 | Exceptional 75.8% |
| Immigrants | Serbia | 94.3 /100 | #121 | Exceptional 75.8% |
| Pakistanis | 94.1 /100 | #122 | Exceptional 75.8% |
| Immigrants | Bulgaria | 94.1 /100 | #123 | Exceptional 75.8% |
| Immigrants | Sierra Leone | 93.8 /100 | #124 | Exceptional 75.8% |
| Immigrants | Scotland | 93.7 /100 | #125 | Exceptional 75.8% |
| Brazilians | 93.0 /100 | #126 | Exceptional 75.8% |
| Sub-Saharan Africans | 90.9 /100 | #127 | Exceptional 75.7% |
| Immigrants | Afghanistan | 89.4 /100 | #128 | Excellent 75.6% |
| Iroquois | 89.1 /100 | #129 | Excellent 75.6% |
| Immigrants | Austria | 88.8 /100 | #130 | Excellent 75.6% |
| Immigrants | Jordan | 88.5 /100 | #131 | Excellent 75.6% |
| Palestinians | 88.4 /100 | #132 | Excellent 75.6% |
Demographics Similar to Immigrants from Indonesia by In Labor Force | Age 20-24
In terms of in labor force | age 20-24, the demographic groups most similar to Immigrants from Indonesia are Belizean (73.4%, a difference of 0.010%), Cheyenne (73.4%, a difference of 0.040%), Immigrants from Russia (73.5%, a difference of 0.050%), Immigrants from Colombia (73.4%, a difference of 0.060%), and Colombian (73.5%, a difference of 0.090%).
| Demographics | Rating | Rank | In Labor Force | Age 20-24 |
| Immigrants | Haiti | 0.5 /100 | #264 | Tragic 73.6% |
| Burmese | 0.5 /100 | #265 | Tragic 73.6% |
| Haitians | 0.5 /100 | #266 | Tragic 73.6% |
| Immigrants | Western Asia | 0.4 /100 | #267 | Tragic 73.5% |
| South Americans | 0.4 /100 | #268 | Tragic 73.5% |
| Colombians | 0.3 /100 | #269 | Tragic 73.5% |
| Immigrants | Russia | 0.3 /100 | #270 | Tragic 73.5% |
| Immigrants | Indonesia | 0.3 /100 | #271 | Tragic 73.4% |
| Belizeans | 0.3 /100 | #272 | Tragic 73.4% |
| Cheyenne | 0.2 /100 | #273 | Tragic 73.4% |
| Immigrants | Colombia | 0.2 /100 | #274 | Tragic 73.4% |
| Immigrants | South America | 0.2 /100 | #275 | Tragic 73.3% |
| Mongolians | 0.2 /100 | #276 | Tragic 73.3% |
| Immigrants | Malaysia | 0.2 /100 | #277 | Tragic 73.3% |
| Cypriots | 0.2 /100 | #278 | Tragic 73.3% |