Iranian vs French In Labor Force | Age 35-44
COMPARE
Iranian
French
In Labor Force | Age 35-44
In Labor Force | Age 35-44 Comparison
Iranians
French
84.5%
IN LABOR FORCE | AGE 35-44
69.4/ 100
METRIC RATING
154th/ 347
METRIC RANK
84.0%
IN LABOR FORCE | AGE 35-44
7.5/ 100
METRIC RATING
220th/ 347
METRIC RANK
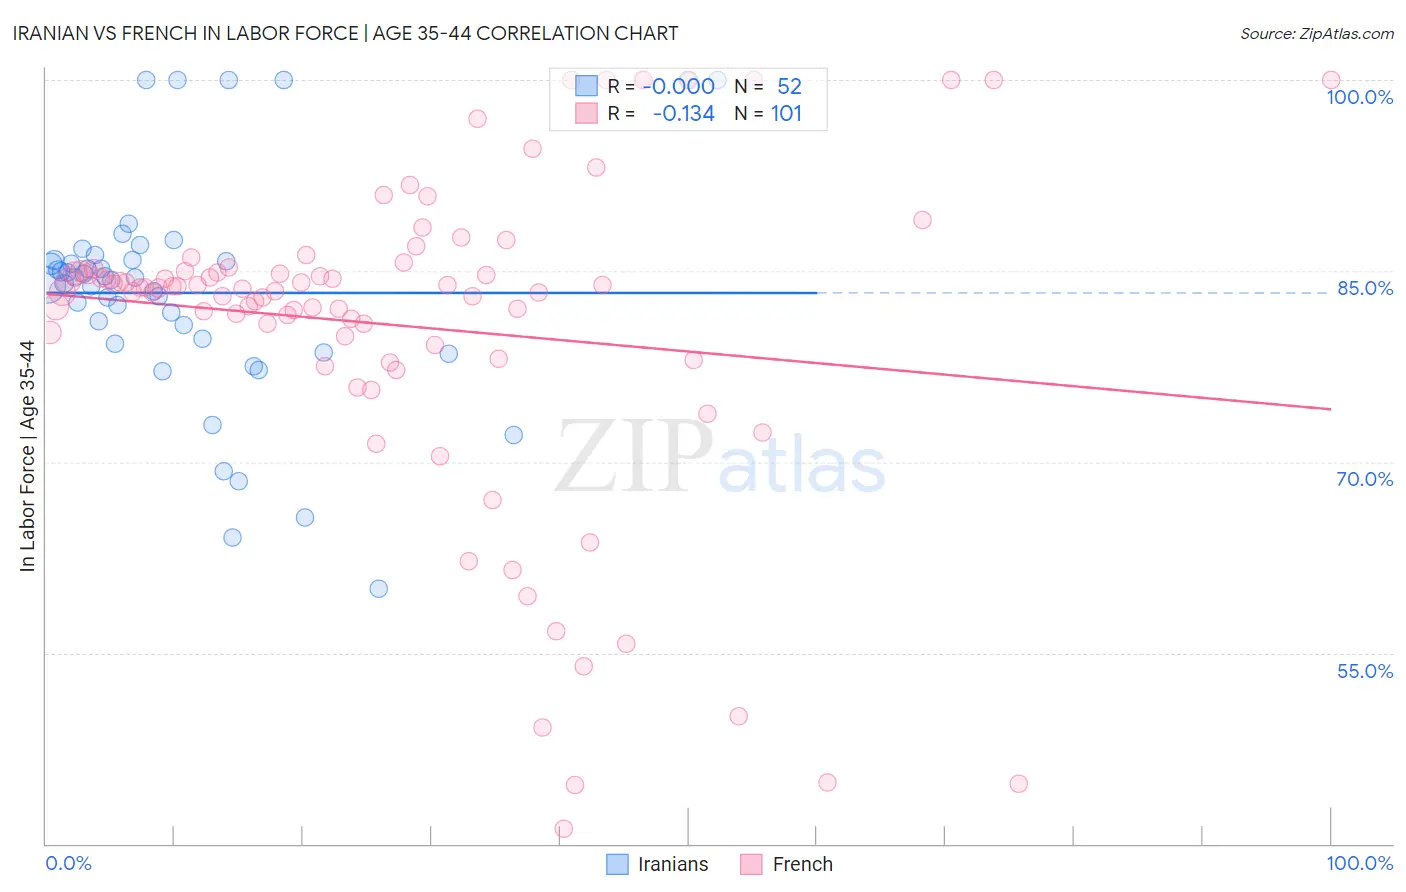
Iranian vs French In Labor Force | Age 35-44 Correlation Chart
The statistical analysis conducted on geographies consisting of 316,731,411 people shows no correlation between the proportion of Iranians and labor force participation rate among population between the ages 35 and 44 in the United States with a correlation coefficient (R) of -0.000 and weighted average of 84.5%. Similarly, the statistical analysis conducted on geographies consisting of 571,709,167 people shows a poor negative correlation between the proportion of French and labor force participation rate among population between the ages 35 and 44 in the United States with a correlation coefficient (R) of -0.134 and weighted average of 84.0%, a difference of 0.54%.
In Labor Force | Age 35-44 Correlation Summary
| Measurement | Iranian | French |
| Minimum | 60.0% | 41.2% |
| Maximum | 100.0% | 100.0% |
| Range | 40.0% | 58.8% |
| Mean | 83.3% | 80.7% |
| Median | 84.4% | 83.7% |
| Interquartile 25% (IQ1) | 79.5% | 78.6% |
| Interquartile 75% (IQ3) | 85.9% | 85.1% |
| Interquartile Range (IQR) | 6.4% | 6.4% |
| Standard Deviation (Sample) | 8.7% | 12.8% |
| Standard Deviation (Population) | 8.7% | 12.8% |
Similar Demographics by In Labor Force | Age 35-44
Demographics Similar to Iranians by In Labor Force | Age 35-44
In terms of in labor force | age 35-44, the demographic groups most similar to Iranians are Trinidadian and Tobagonian (84.5%, a difference of 0.0%), Romanian (84.5%, a difference of 0.020%), Immigrants from Taiwan (84.5%, a difference of 0.020%), South American Indian (84.5%, a difference of 0.030%), and Okinawan (84.5%, a difference of 0.030%).
| Demographics | Rating | Rank | In Labor Force | Age 35-44 |
| Immigrants | Netherlands | 76.6 /100 | #147 | Good 84.5% |
| South American Indians | 73.6 /100 | #148 | Good 84.5% |
| Okinawans | 73.5 /100 | #149 | Good 84.5% |
| Immigrants | Nigeria | 73.3 /100 | #150 | Good 84.5% |
| Romanians | 72.1 /100 | #151 | Good 84.5% |
| Immigrants | Taiwan | 71.4 /100 | #152 | Good 84.5% |
| Trinidadians and Tobagonians | 69.5 /100 | #153 | Good 84.5% |
| Iranians | 69.4 /100 | #154 | Good 84.5% |
| Immigrants | Switzerland | 65.9 /100 | #155 | Good 84.5% |
| Immigrants | Israel | 64.3 /100 | #156 | Good 84.4% |
| Immigrants | Austria | 63.8 /100 | #157 | Good 84.4% |
| Jamaicans | 62.7 /100 | #158 | Good 84.4% |
| Immigrants | Senegal | 60.4 /100 | #159 | Good 84.4% |
| Immigrants | Kazakhstan | 60.4 /100 | #160 | Good 84.4% |
| Immigrants | Venezuela | 60.0 /100 | #161 | Good 84.4% |
Demographics Similar to French by In Labor Force | Age 35-44
In terms of in labor force | age 35-44, the demographic groups most similar to French are Icelander (84.0%, a difference of 0.020%), Assyrian/Chaldean/Syriac (84.0%, a difference of 0.020%), Immigrants from Panama (84.0%, a difference of 0.030%), Immigrants from Nicaragua (84.1%, a difference of 0.040%), and Subsaharan African (84.1%, a difference of 0.040%).
| Demographics | Rating | Rank | In Labor Force | Age 35-44 |
| Bangladeshis | 13.7 /100 | #213 | Poor 84.1% |
| Immigrants | Barbados | 13.2 /100 | #214 | Poor 84.1% |
| Europeans | 12.2 /100 | #215 | Poor 84.1% |
| Nicaraguans | 12.1 /100 | #216 | Poor 84.1% |
| Immigrants | Norway | 11.7 /100 | #217 | Poor 84.1% |
| Immigrants | Nicaragua | 9.4 /100 | #218 | Tragic 84.1% |
| Sub-Saharan Africans | 9.3 /100 | #219 | Tragic 84.1% |
| French | 7.5 /100 | #220 | Tragic 84.0% |
| Icelanders | 6.7 /100 | #221 | Tragic 84.0% |
| Assyrians/Chaldeans/Syriacs | 6.6 /100 | #222 | Tragic 84.0% |
| Immigrants | Panama | 6.4 /100 | #223 | Tragic 84.0% |
| U.S. Virgin Islanders | 6.1 /100 | #224 | Tragic 84.0% |
| Immigrants | Burma/Myanmar | 6.1 /100 | #225 | Tragic 84.0% |
| Panamanians | 5.4 /100 | #226 | Tragic 84.0% |
| British West Indians | 5.3 /100 | #227 | Tragic 84.0% |