Lumbee vs Carpatho Rusyn In Labor Force | Age 16-19
COMPARE
Lumbee
Carpatho Rusyn
In Labor Force | Age 16-19
In Labor Force | Age 16-19 Comparison
Lumbee
Carpatho Rusyns
31.0%
IN LABOR FORCE | AGE 16-19
0.0/ 100
METRIC RATING
330th/ 347
METRIC RANK
40.8%
IN LABOR FORCE | AGE 16-19
100.0/ 100
METRIC RATING
47th/ 347
METRIC RANK
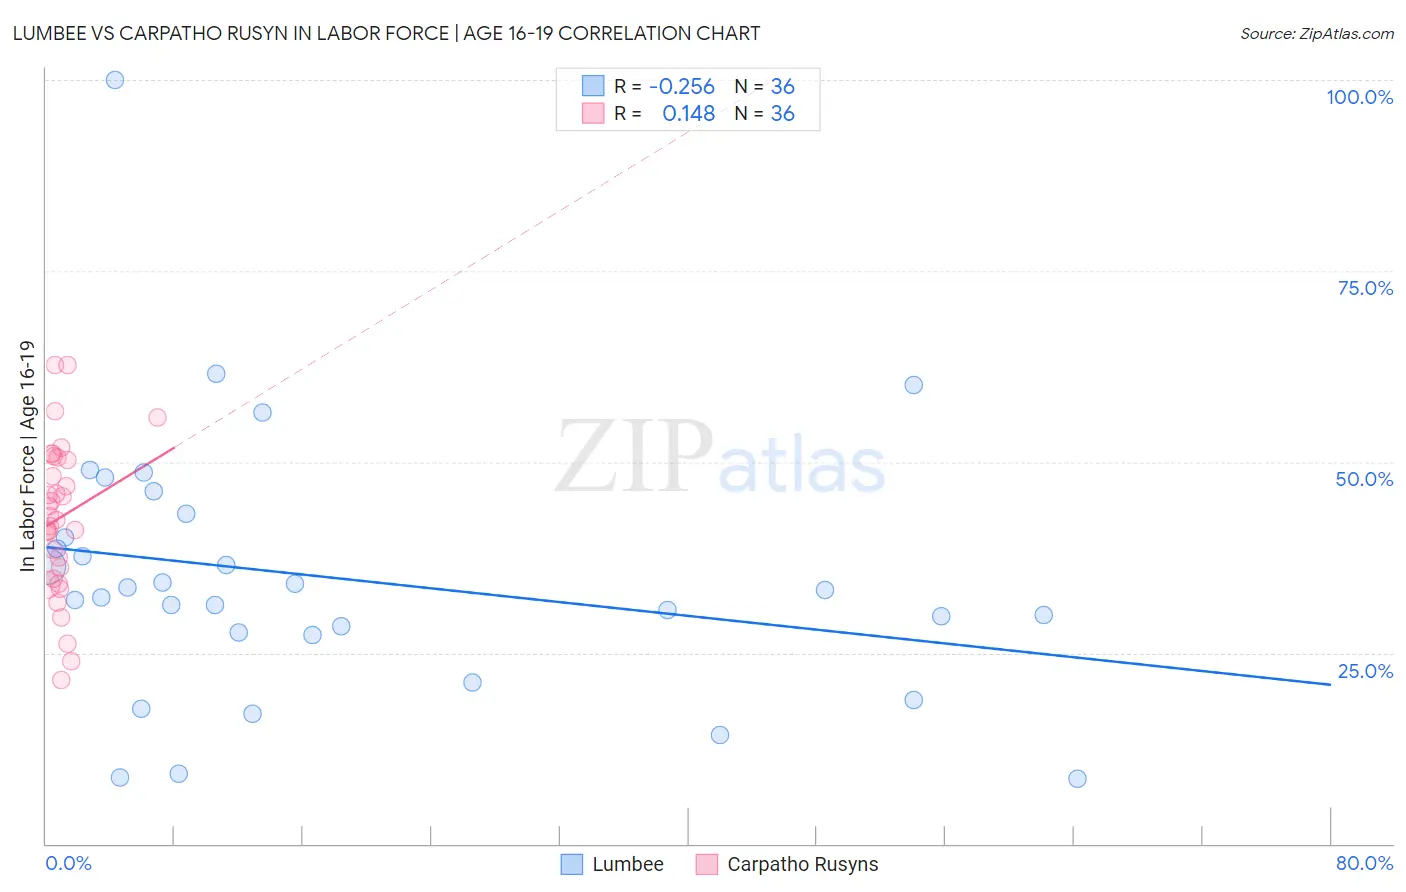
Lumbee vs Carpatho Rusyn In Labor Force | Age 16-19 Correlation Chart
The statistical analysis conducted on geographies consisting of 92,241,195 people shows a weak negative correlation between the proportion of Lumbee and labor force participation rate among population between the ages 16 and 19 in the United States with a correlation coefficient (R) of -0.256 and weighted average of 31.0%. Similarly, the statistical analysis conducted on geographies consisting of 58,860,785 people shows a poor positive correlation between the proportion of Carpatho Rusyns and labor force participation rate among population between the ages 16 and 19 in the United States with a correlation coefficient (R) of 0.148 and weighted average of 40.8%, a difference of 31.7%.
In Labor Force | Age 16-19 Correlation Summary
| Measurement | Lumbee | Carpatho Rusyn |
| Minimum | 8.5% | 21.5% |
| Maximum | 100.0% | 62.8% |
| Range | 91.5% | 41.3% |
| Mean | 34.8% | 42.7% |
| Median | 32.7% | 42.6% |
| Interquartile 25% (IQ1) | 27.5% | 35.4% |
| Interquartile 75% (IQ3) | 41.7% | 50.5% |
| Interquartile Range (IQR) | 14.2% | 15.1% |
| Standard Deviation (Sample) | 17.4% | 9.9% |
| Standard Deviation (Population) | 17.2% | 9.8% |
Similar Demographics by In Labor Force | Age 16-19
Demographics Similar to Lumbee by In Labor Force | Age 16-19
In terms of in labor force | age 16-19, the demographic groups most similar to Lumbee are Barbadian (31.0%, a difference of 0.12%), Immigrants from Ecuador (31.0%, a difference of 0.15%), Trinidadian and Tobagonian (30.9%, a difference of 0.15%), Immigrants from Taiwan (31.0%, a difference of 0.19%), and Immigrants from Dominican Republic (31.1%, a difference of 0.35%).
| Demographics | Rating | Rank | In Labor Force | Age 16-19 |
| Immigrants | Caribbean | 0.0 /100 | #323 | Tragic 31.2% |
| Dominicans | 0.0 /100 | #324 | Tragic 31.2% |
| Immigrants | China | 0.0 /100 | #325 | Tragic 31.1% |
| Immigrants | Dominican Republic | 0.0 /100 | #326 | Tragic 31.1% |
| Immigrants | Taiwan | 0.0 /100 | #327 | Tragic 31.0% |
| Immigrants | Ecuador | 0.0 /100 | #328 | Tragic 31.0% |
| Barbadians | 0.0 /100 | #329 | Tragic 31.0% |
| Lumbee | 0.0 /100 | #330 | Tragic 31.0% |
| Trinidadians and Tobagonians | 0.0 /100 | #331 | Tragic 30.9% |
| Immigrants | Israel | 0.0 /100 | #332 | Tragic 30.5% |
| Immigrants | Hong Kong | 0.0 /100 | #333 | Tragic 30.5% |
| Puerto Ricans | 0.0 /100 | #334 | Tragic 30.3% |
| Immigrants | Cuba | 0.0 /100 | #335 | Tragic 30.2% |
| Immigrants | Trinidad and Tobago | 0.0 /100 | #336 | Tragic 30.2% |
| Immigrants | Bangladesh | 0.0 /100 | #337 | Tragic 30.0% |
Demographics Similar to Carpatho Rusyns by In Labor Force | Age 16-19
In terms of in labor force | age 16-19, the demographic groups most similar to Carpatho Rusyns are Icelander (40.8%, a difference of 0.050%), Cree (40.8%, a difference of 0.070%), Indonesian (40.7%, a difference of 0.23%), Immigrants from Zaire (40.7%, a difference of 0.33%), and Immigrants from Laos (40.6%, a difference of 0.42%).
| Demographics | Rating | Rank | In Labor Force | Age 16-19 |
| Immigrants | Liberia | 100.0 /100 | #40 | Exceptional 41.5% |
| Celtics | 100.0 /100 | #41 | Exceptional 41.3% |
| Whites/Caucasians | 100.0 /100 | #42 | Exceptional 41.3% |
| Tongans | 100.0 /100 | #43 | Exceptional 41.2% |
| Europeans | 100.0 /100 | #44 | Exceptional 41.1% |
| Croatians | 100.0 /100 | #45 | Exceptional 41.1% |
| Immigrants | Sudan | 100.0 /100 | #46 | Exceptional 41.0% |
| Carpatho Rusyns | 100.0 /100 | #47 | Exceptional 40.8% |
| Icelanders | 100.0 /100 | #48 | Exceptional 40.8% |
| Cree | 100.0 /100 | #49 | Exceptional 40.8% |
| Indonesians | 100.0 /100 | #50 | Exceptional 40.7% |
| Immigrants | Zaire | 100.0 /100 | #51 | Exceptional 40.7% |
| Immigrants | Laos | 100.0 /100 | #52 | Exceptional 40.6% |
| Immigrants | Kenya | 100.0 /100 | #53 | Exceptional 40.5% |
| Tlingit-Haida | 100.0 /100 | #54 | Exceptional 40.5% |