Native Hawaiian vs Hopi In Labor Force | Age 35-44
COMPARE
Native Hawaiian
Hopi
In Labor Force | Age 35-44
In Labor Force | Age 35-44 Comparison
Native Hawaiians
Hopi
83.9%
IN LABOR FORCE | AGE 35-44
3.0/ 100
METRIC RATING
232nd/ 347
METRIC RANK
77.0%
IN LABOR FORCE | AGE 35-44
0.0/ 100
METRIC RATING
341st/ 347
METRIC RANK
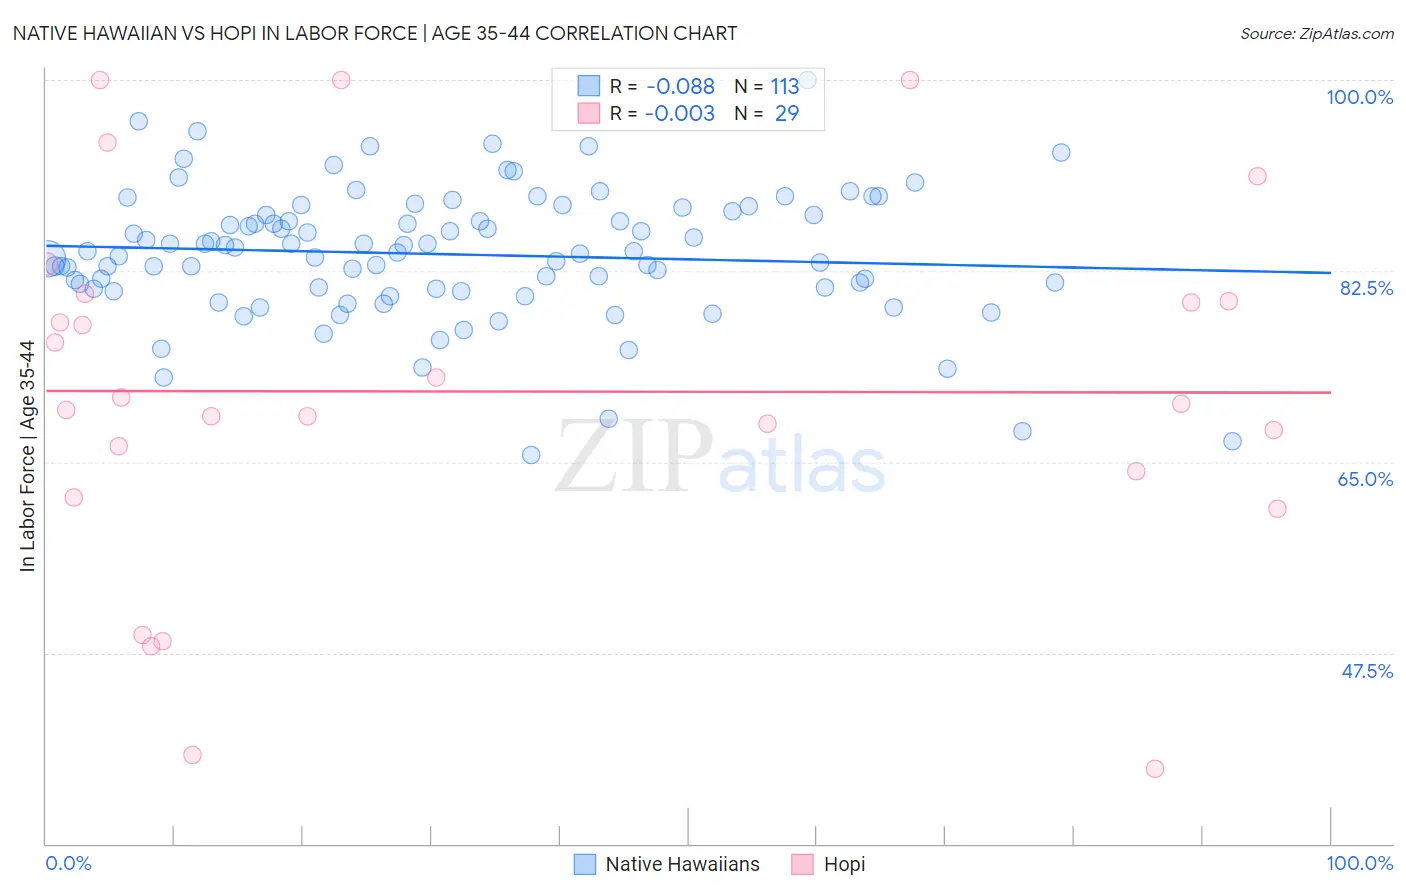
Native Hawaiian vs Hopi In Labor Force | Age 35-44 Correlation Chart
The statistical analysis conducted on geographies consisting of 331,970,144 people shows a slight negative correlation between the proportion of Native Hawaiians and labor force participation rate among population between the ages 35 and 44 in the United States with a correlation coefficient (R) of -0.088 and weighted average of 83.9%. Similarly, the statistical analysis conducted on geographies consisting of 74,733,485 people shows no correlation between the proportion of Hopi and labor force participation rate among population between the ages 35 and 44 in the United States with a correlation coefficient (R) of -0.003 and weighted average of 77.0%, a difference of 9.0%.
In Labor Force | Age 35-44 Correlation Summary
| Measurement | Native Hawaiian | Hopi |
| Minimum | 65.6% | 36.9% |
| Maximum | 100.0% | 100.0% |
| Range | 34.4% | 63.1% |
| Mean | 84.0% | 71.4% |
| Median | 84.3% | 70.3% |
| Interquartile 25% (IQ1) | 80.9% | 62.9% |
| Interquartile 75% (IQ3) | 87.8% | 80.1% |
| Interquartile Range (IQR) | 7.0% | 17.1% |
| Standard Deviation (Sample) | 6.0% | 16.9% |
| Standard Deviation (Population) | 6.0% | 16.6% |
Similar Demographics by In Labor Force | Age 35-44
Demographics Similar to Native Hawaiians by In Labor Force | Age 35-44
In terms of in labor force | age 35-44, the demographic groups most similar to Native Hawaiians are Scottish (83.9%, a difference of 0.010%), Immigrants from Germany (83.9%, a difference of 0.010%), Immigrants from Oceania (83.9%, a difference of 0.020%), Immigrants from Syria (83.9%, a difference of 0.030%), and Immigrants from Iraq (83.9%, a difference of 0.040%).
| Demographics | Rating | Rank | In Labor Force | Age 35-44 |
| Immigrants | Burma/Myanmar | 6.1 /100 | #225 | Tragic 84.0% |
| Panamanians | 5.4 /100 | #226 | Tragic 84.0% |
| British West Indians | 5.3 /100 | #227 | Tragic 84.0% |
| Welsh | 5.3 /100 | #228 | Tragic 84.0% |
| Immigrants | Thailand | 4.7 /100 | #229 | Tragic 84.0% |
| Immigrants | Iraq | 3.7 /100 | #230 | Tragic 83.9% |
| Scottish | 3.2 /100 | #231 | Tragic 83.9% |
| Native Hawaiians | 3.0 /100 | #232 | Tragic 83.9% |
| Immigrants | Germany | 2.8 /100 | #233 | Tragic 83.9% |
| Immigrants | Oceania | 2.6 /100 | #234 | Tragic 83.9% |
| Immigrants | Syria | 2.5 /100 | #235 | Tragic 83.9% |
| West Indians | 2.4 /100 | #236 | Tragic 83.9% |
| English | 1.8 /100 | #237 | Tragic 83.8% |
| Immigrants | Laos | 1.7 /100 | #238 | Tragic 83.8% |
| Celtics | 1.4 /100 | #239 | Tragic 83.8% |
Demographics Similar to Hopi by In Labor Force | Age 35-44
In terms of in labor force | age 35-44, the demographic groups most similar to Hopi are Lumbee (77.0%, a difference of 0.050%), Yup'ik (77.3%, a difference of 0.40%), Pueblo (77.4%, a difference of 0.50%), Crow (76.5%, a difference of 0.64%), and Immigrants from Yemen (76.3%, a difference of 0.88%).
| Demographics | Rating | Rank | In Labor Force | Age 35-44 |
| Kiowa | 0.0 /100 | #333 | Tragic 79.2% |
| Yakama | 0.0 /100 | #334 | Tragic 79.0% |
| Natives/Alaskans | 0.0 /100 | #335 | Tragic 78.9% |
| Arapaho | 0.0 /100 | #336 | Tragic 78.1% |
| Apache | 0.0 /100 | #337 | Tragic 77.9% |
| Pueblo | 0.0 /100 | #338 | Tragic 77.4% |
| Yup'ik | 0.0 /100 | #339 | Tragic 77.3% |
| Lumbee | 0.0 /100 | #340 | Tragic 77.0% |
| Hopi | 0.0 /100 | #341 | Tragic 77.0% |
| Crow | 0.0 /100 | #342 | Tragic 76.5% |
| Immigrants | Yemen | 0.0 /100 | #343 | Tragic 76.3% |
| Pima | 0.0 /100 | #344 | Tragic 74.8% |
| Yuman | 0.0 /100 | #345 | Tragic 74.7% |
| Tohono O'odham | 0.0 /100 | #346 | Tragic 74.1% |
| Navajo | 0.0 /100 | #347 | Tragic 73.8% |