Pima vs Cape Verdean In Labor Force | Age 45-54
COMPARE
Pima
Cape Verdean
In Labor Force | Age 45-54
In Labor Force | Age 45-54 Comparison
Pima
Cape Verdeans
72.8%
IN LABOR FORCE | AGE 45-54
0.0/ 100
METRIC RATING
346th/ 347
METRIC RANK
82.1%
IN LABOR FORCE | AGE 45-54
2.1/ 100
METRIC RATING
228th/ 347
METRIC RANK
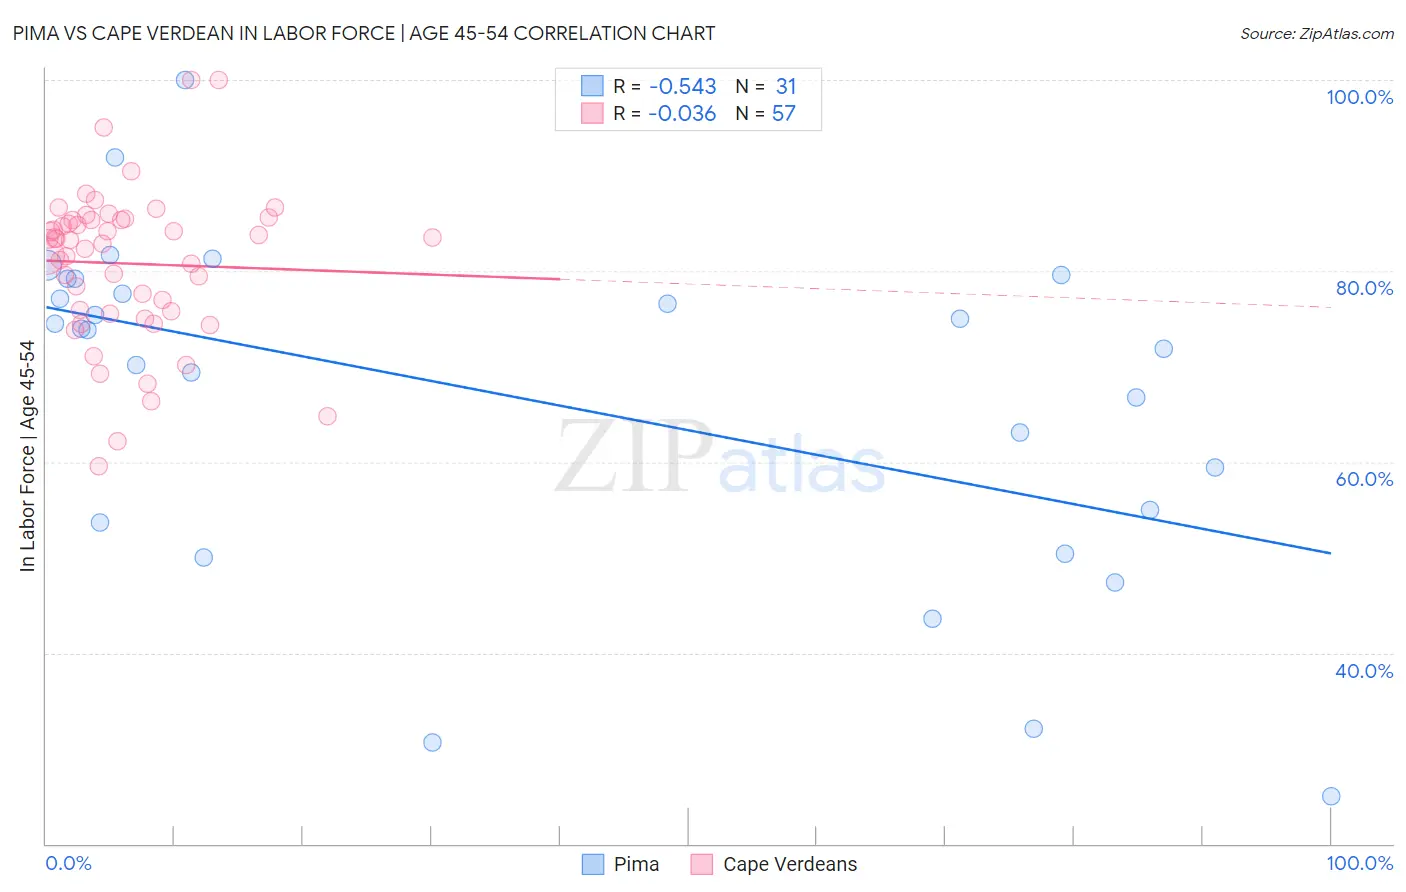
Pima vs Cape Verdean In Labor Force | Age 45-54 Correlation Chart
The statistical analysis conducted on geographies consisting of 61,535,114 people shows a substantial negative correlation between the proportion of Pima and labor force participation rate among population between the ages 45 and 54 in the United States with a correlation coefficient (R) of -0.543 and weighted average of 72.8%. Similarly, the statistical analysis conducted on geographies consisting of 107,547,250 people shows no correlation between the proportion of Cape Verdeans and labor force participation rate among population between the ages 45 and 54 in the United States with a correlation coefficient (R) of -0.036 and weighted average of 82.1%, a difference of 12.7%.
In Labor Force | Age 45-54 Correlation Summary
| Measurement | Pima | Cape Verdean |
| Minimum | 25.0% | 59.5% |
| Maximum | 100.0% | 100.0% |
| Range | 75.0% | 40.5% |
| Mean | 66.6% | 80.8% |
| Median | 73.9% | 83.2% |
| Interquartile 25% (IQ1) | 53.6% | 75.7% |
| Interquartile 75% (IQ3) | 79.2% | 85.4% |
| Interquartile Range (IQR) | 25.5% | 9.7% |
| Standard Deviation (Sample) | 17.9% | 8.0% |
| Standard Deviation (Population) | 17.6% | 8.0% |
Similar Demographics by In Labor Force | Age 45-54
Demographics Similar to Pima by In Labor Force | Age 45-54
In terms of in labor force | age 45-54, the demographic groups most similar to Pima are Navajo (72.8%, a difference of 0.050%), Houma (74.1%, a difference of 1.7%), Immigrants from Yemen (74.4%, a difference of 2.2%), Hopi (75.0%, a difference of 3.0%), and Tohono O'odham (75.1%, a difference of 3.2%).
| Demographics | Rating | Rank | In Labor Force | Age 45-54 |
| Natives/Alaskans | 0.0 /100 | #333 | Tragic 77.1% |
| Apache | 0.0 /100 | #334 | Tragic 77.1% |
| Arapaho | 0.0 /100 | #335 | Tragic 77.1% |
| Paiute | 0.0 /100 | #336 | Tragic 76.7% |
| Ute | 0.0 /100 | #337 | Tragic 76.6% |
| Yuman | 0.0 /100 | #338 | Tragic 76.3% |
| Puerto Ricans | 0.0 /100 | #339 | Tragic 75.9% |
| Lumbee | 0.0 /100 | #340 | Tragic 75.6% |
| Pueblo | 0.0 /100 | #341 | Tragic 75.5% |
| Tohono O'odham | 0.0 /100 | #342 | Tragic 75.1% |
| Hopi | 0.0 /100 | #343 | Tragic 75.0% |
| Immigrants | Yemen | 0.0 /100 | #344 | Tragic 74.4% |
| Houma | 0.0 /100 | #345 | Tragic 74.1% |
| Pima | 0.0 /100 | #346 | Tragic 72.8% |
| Navajo | 0.0 /100 | #347 | Tragic 72.8% |
Demographics Similar to Cape Verdeans by In Labor Force | Age 45-54
In terms of in labor force | age 45-54, the demographic groups most similar to Cape Verdeans are Immigrants from Burma/Myanmar (82.0%, a difference of 0.020%), Immigrants from Germany (82.1%, a difference of 0.030%), Immigrants from Oceania (82.1%, a difference of 0.040%), Immigrants from Caribbean (82.1%, a difference of 0.040%), and Jamaican (82.0%, a difference of 0.040%).
| Demographics | Rating | Rank | In Labor Force | Age 45-54 |
| Panamanians | 3.5 /100 | #221 | Tragic 82.2% |
| Immigrants | Ecuador | 3.4 /100 | #222 | Tragic 82.2% |
| Immigrants | Immigrants | 3.1 /100 | #223 | Tragic 82.1% |
| Immigrants | Jamaica | 2.7 /100 | #224 | Tragic 82.1% |
| Immigrants | Oceania | 2.5 /100 | #225 | Tragic 82.1% |
| Immigrants | Caribbean | 2.5 /100 | #226 | Tragic 82.1% |
| Immigrants | Germany | 2.4 /100 | #227 | Tragic 82.1% |
| Cape Verdeans | 2.1 /100 | #228 | Tragic 82.1% |
| Immigrants | Burma/Myanmar | 1.9 /100 | #229 | Tragic 82.0% |
| Jamaicans | 1.8 /100 | #230 | Tragic 82.0% |
| Immigrants | Senegal | 1.7 /100 | #231 | Tragic 82.0% |
| Immigrants | Portugal | 1.7 /100 | #232 | Tragic 82.0% |
| Malaysians | 1.7 /100 | #233 | Tragic 82.0% |
| Salvadorans | 1.7 /100 | #234 | Tragic 82.0% |
| Sub-Saharan Africans | 1.2 /100 | #235 | Tragic 82.0% |